Attribute Analysis
1.Overview
Attribute analysis, that is, divide customers according to their attributes, and understand the distribution of the number of customers for a certain attribute. For example, the gender distribution of customers, the distribution of provinces, the distribution of sources, etc
2.Why is attribute analysis needed?
Understanding the group portrait: What are the characteristics of the customer group you are concerned about, and what are their demographic attributes
Assisting long-term marketing strategy:
- What channel has brought the greatest customer acquisition?
- At what stage are the customers concentrated now?
- Which campaign brought the largest number of customers?
In this way, companies can devote more resources to more efficient channels and methods.
According to the current dimensions and indexes that can be set for customer analysis, these analyses can be carried out:
- What (city/company/province, dimension) has the most customers (large amount/active, index?)
- What (channel/event/promoter) brings the most (large amount/active/high number of orders) customers?
- What time has the customer (quantity/activity/order) increased the fastest (only creation time)?
3.Process guide
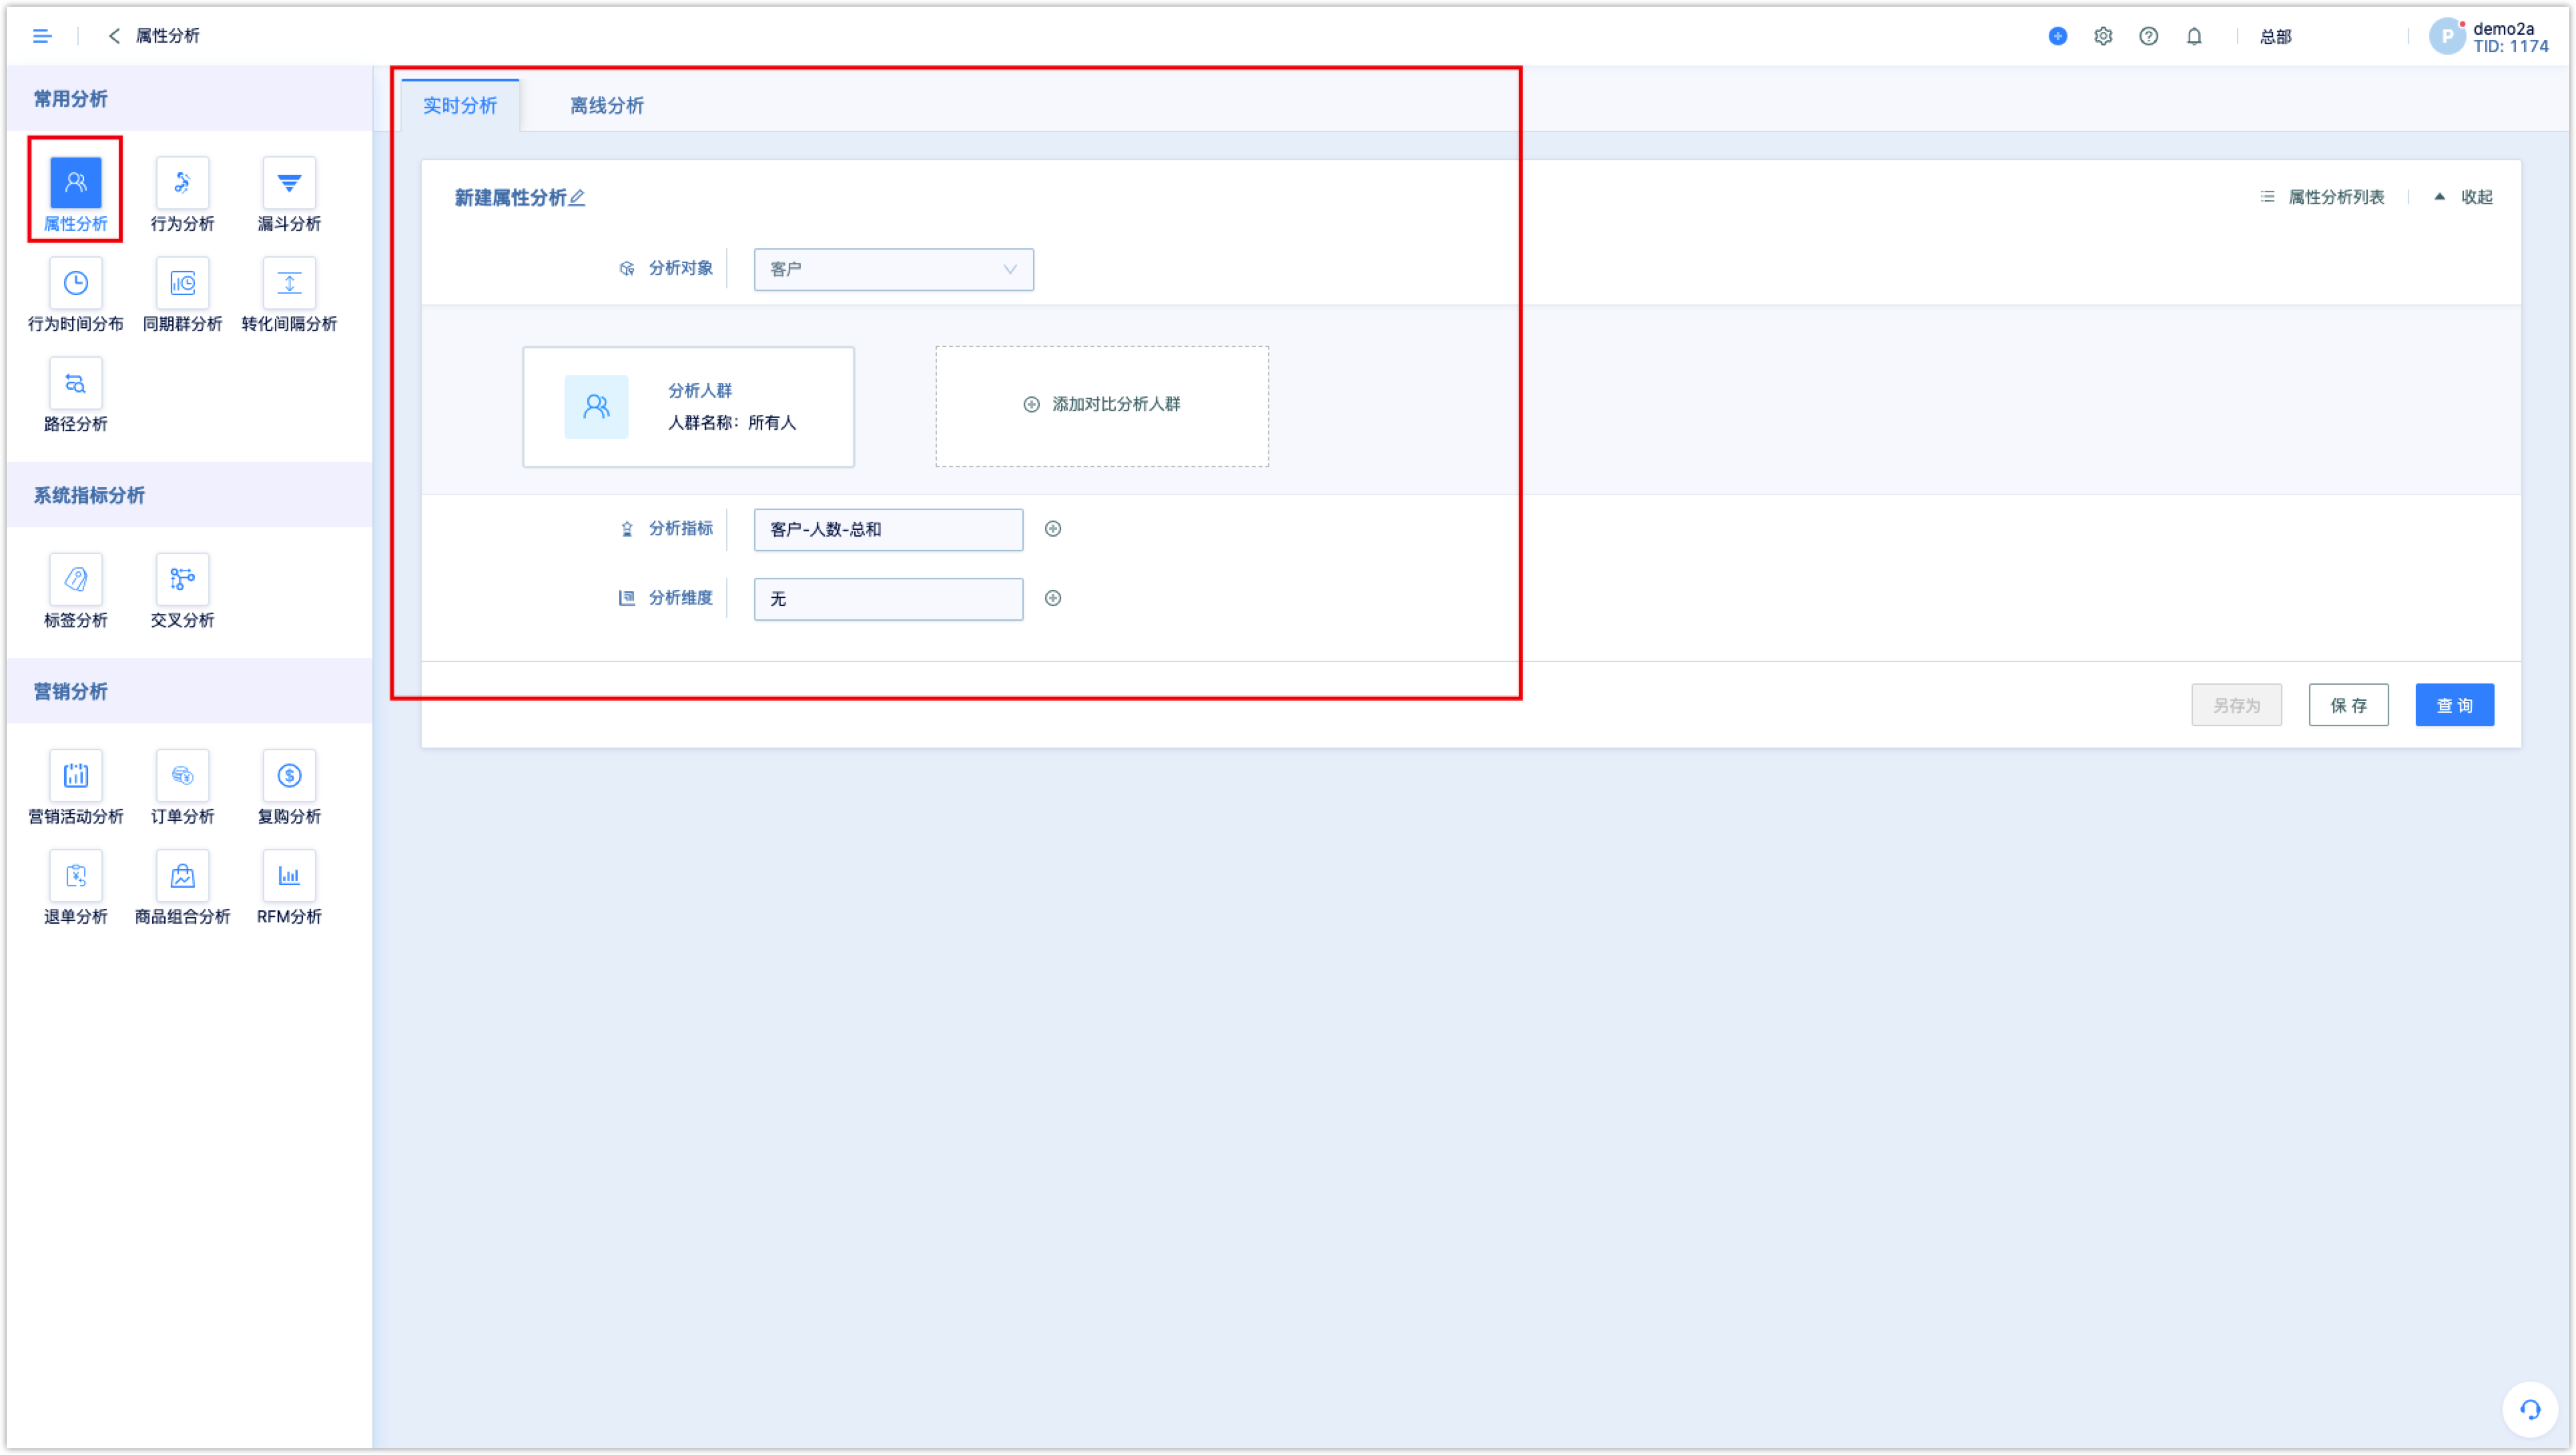
3.1Select the analysis object and group
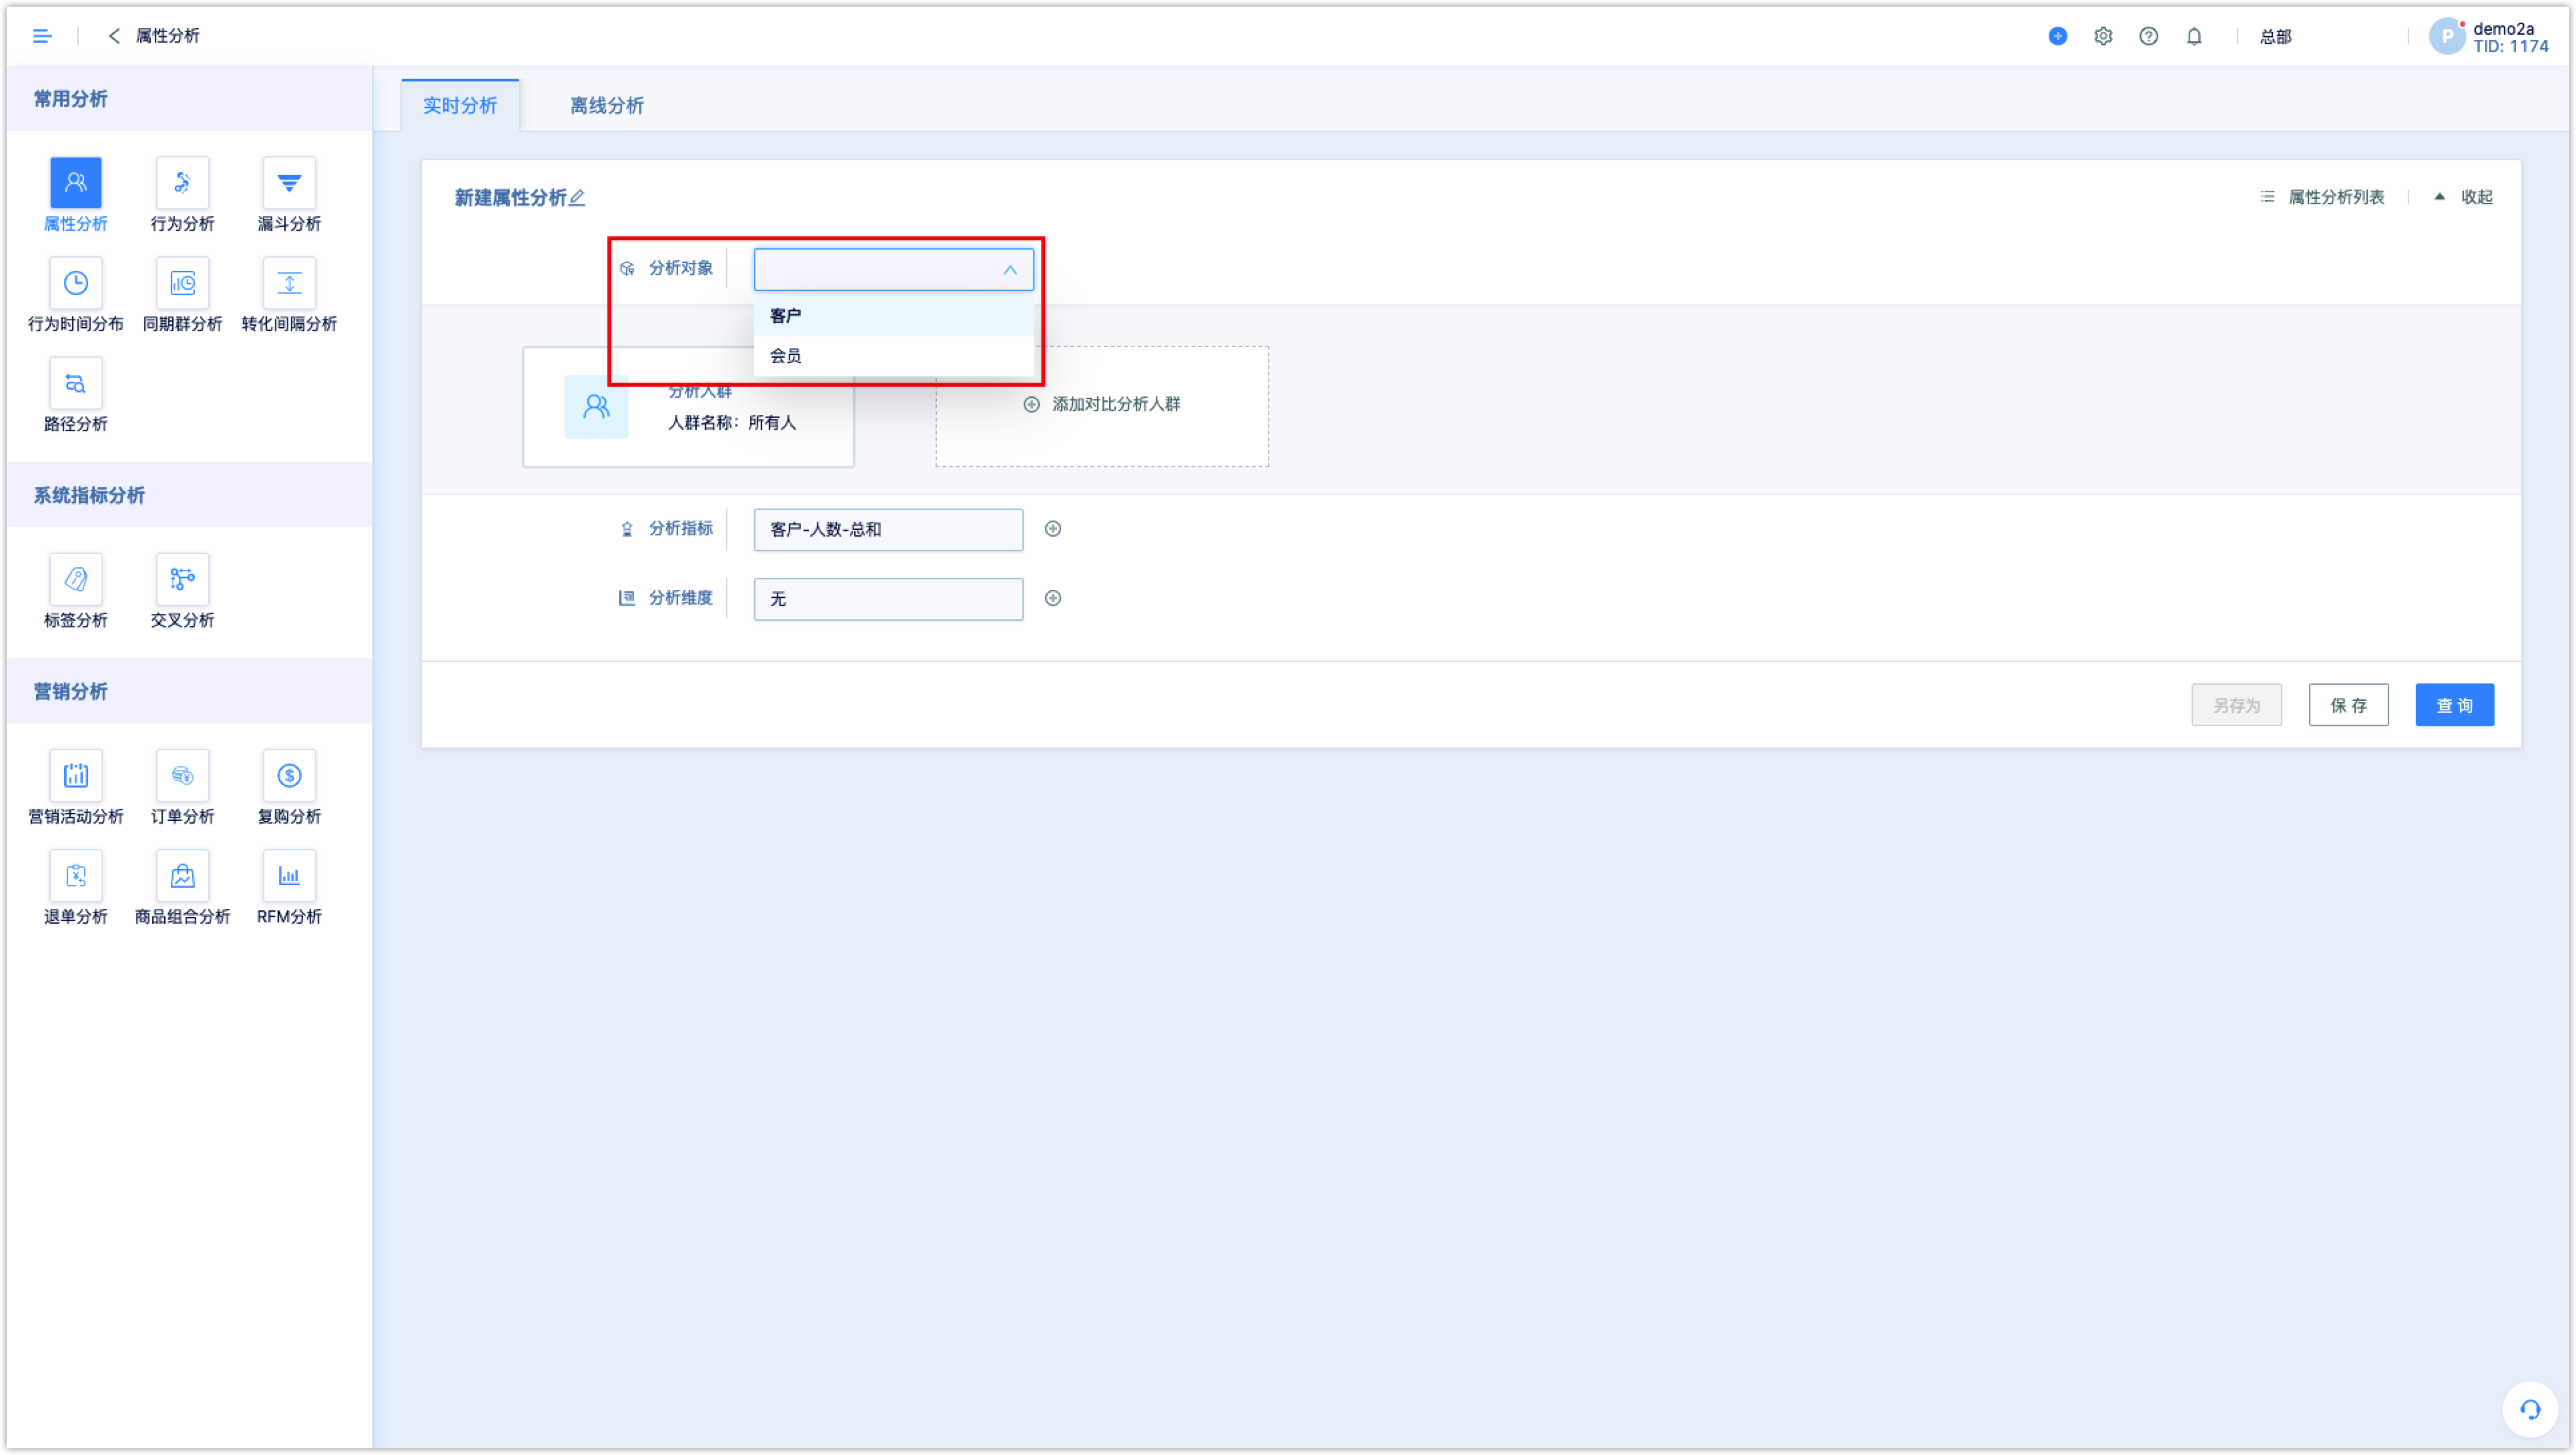
If the tenant has activated the feature of [member], The first step is choosing whether the analysis object is [Customer] or [Member].
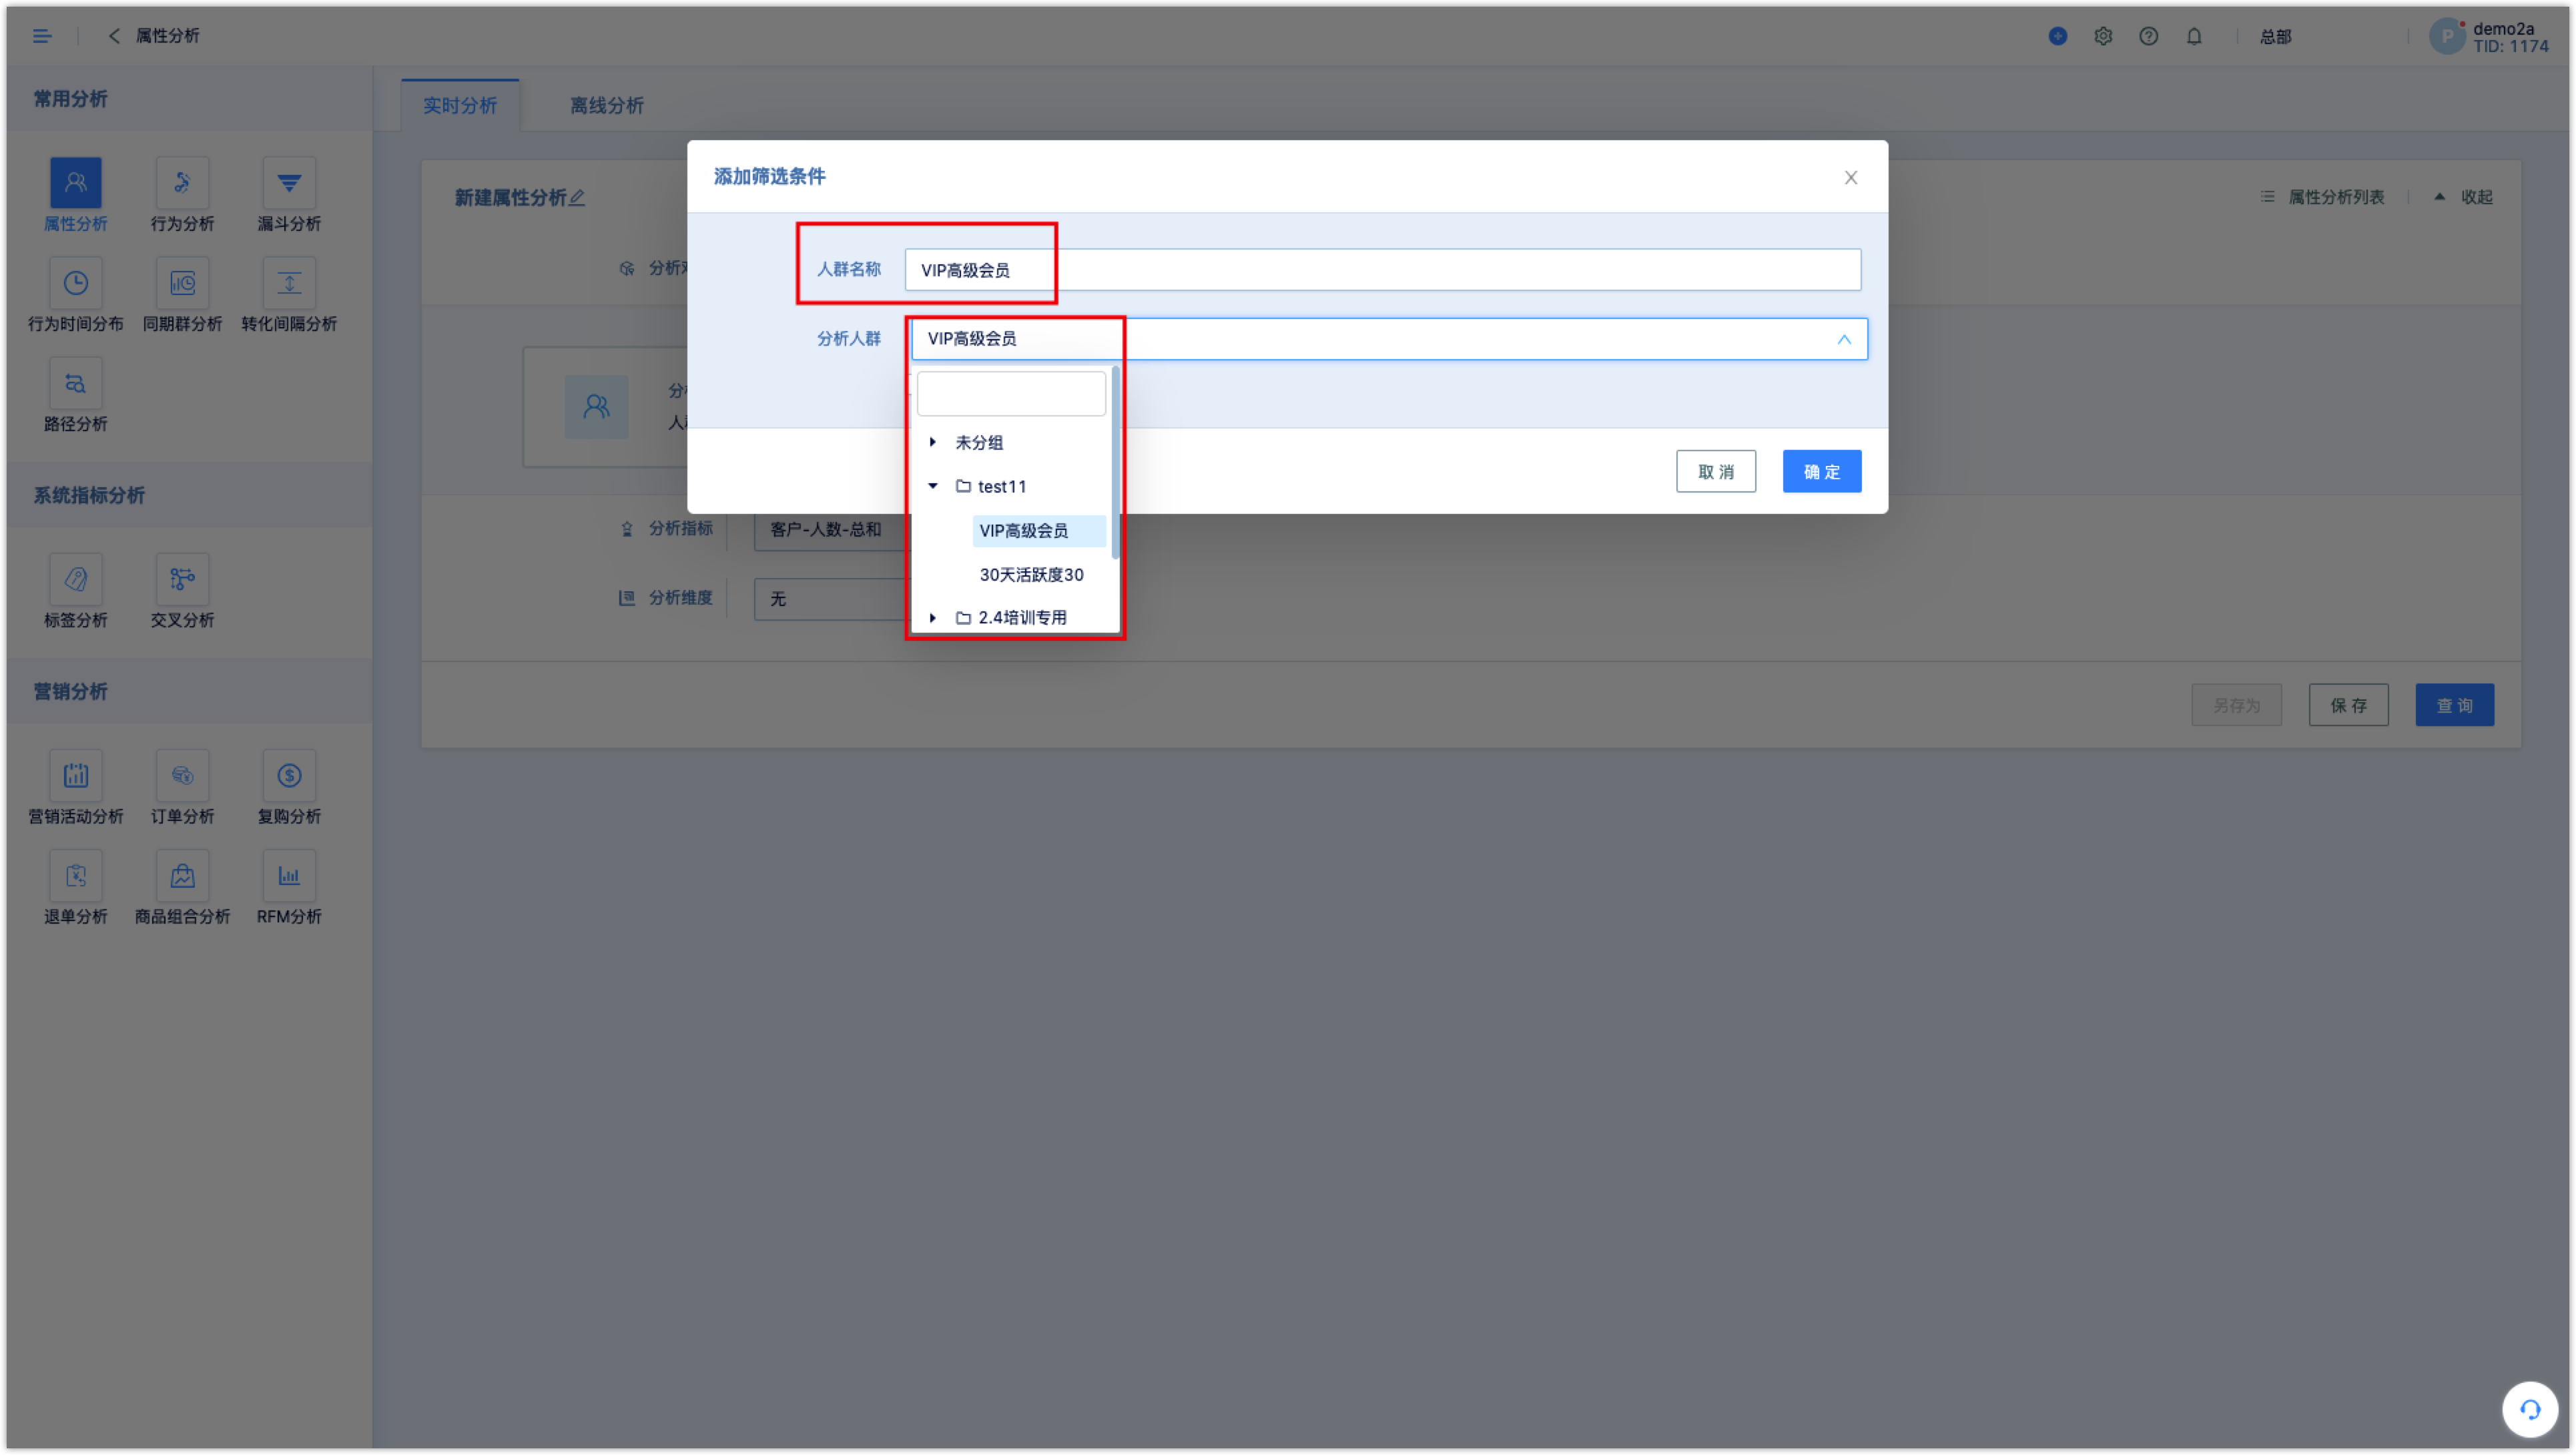
Then select the analysis group, the default is all. If the limit the analysis group is needed, click the edit button to select or filter the group.
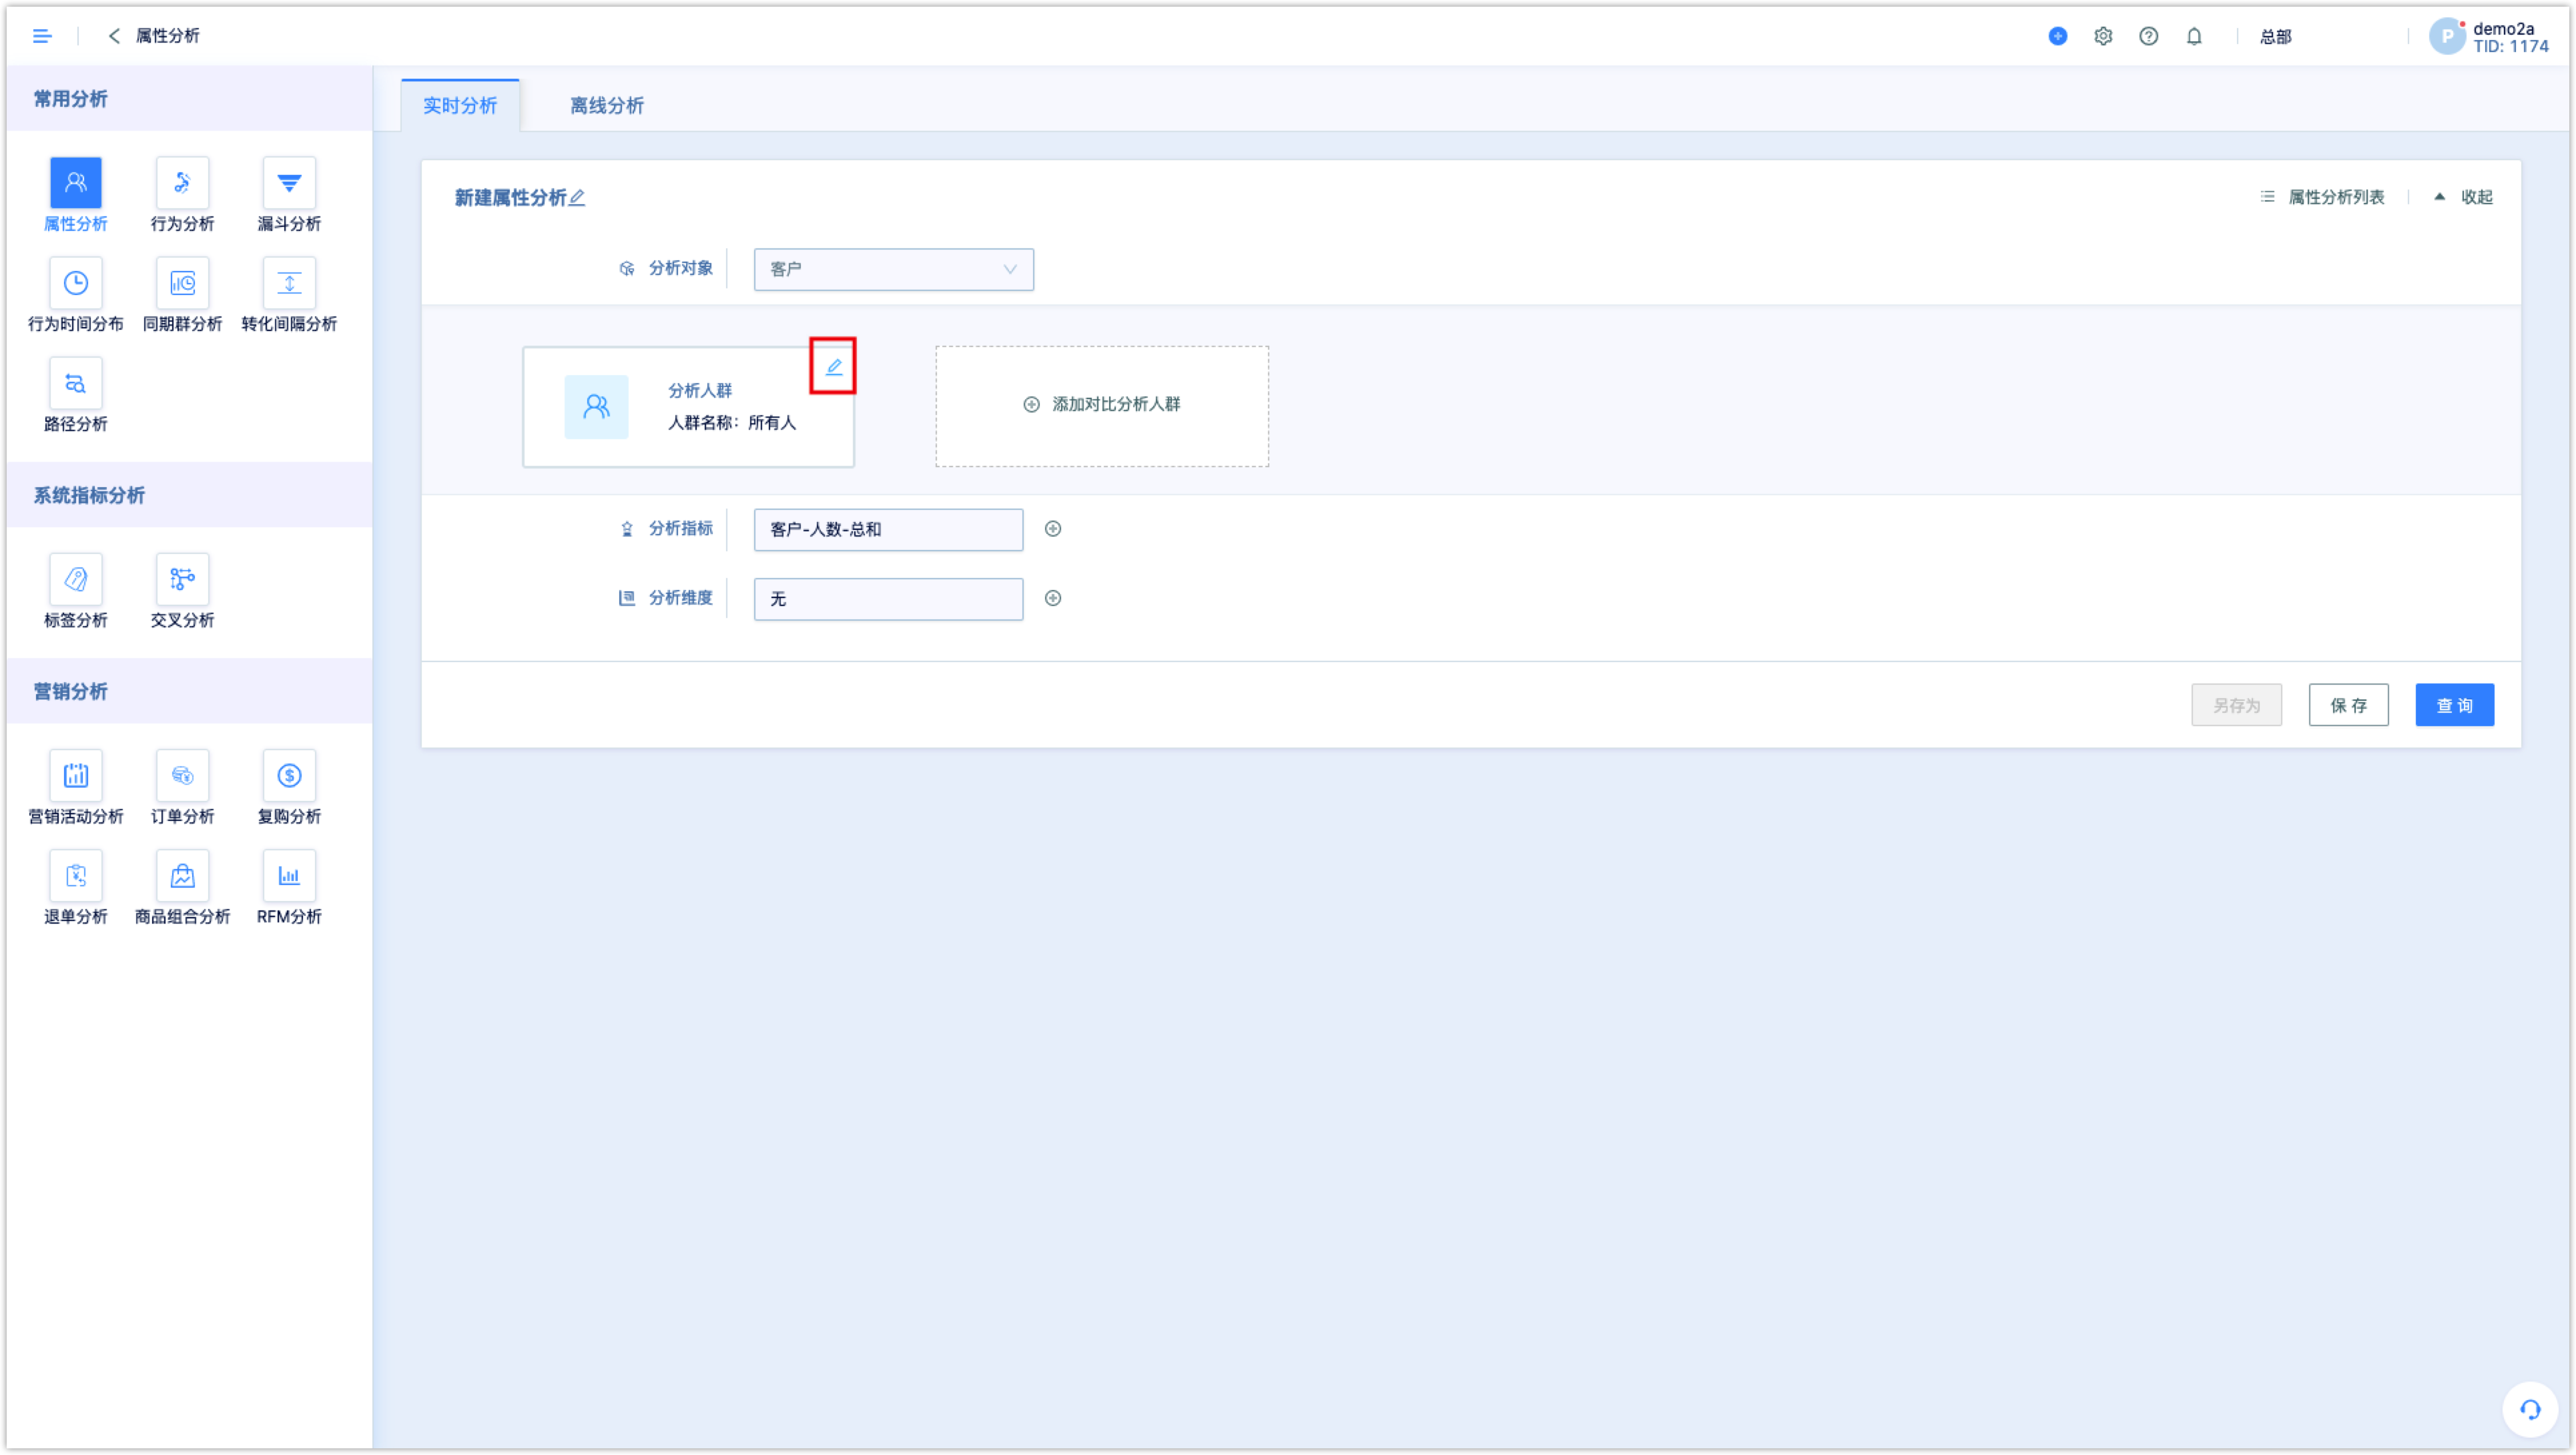
Fill in the name of the analysis group. If the group has already been filtered out, you can directly select the group in the drop-down box.
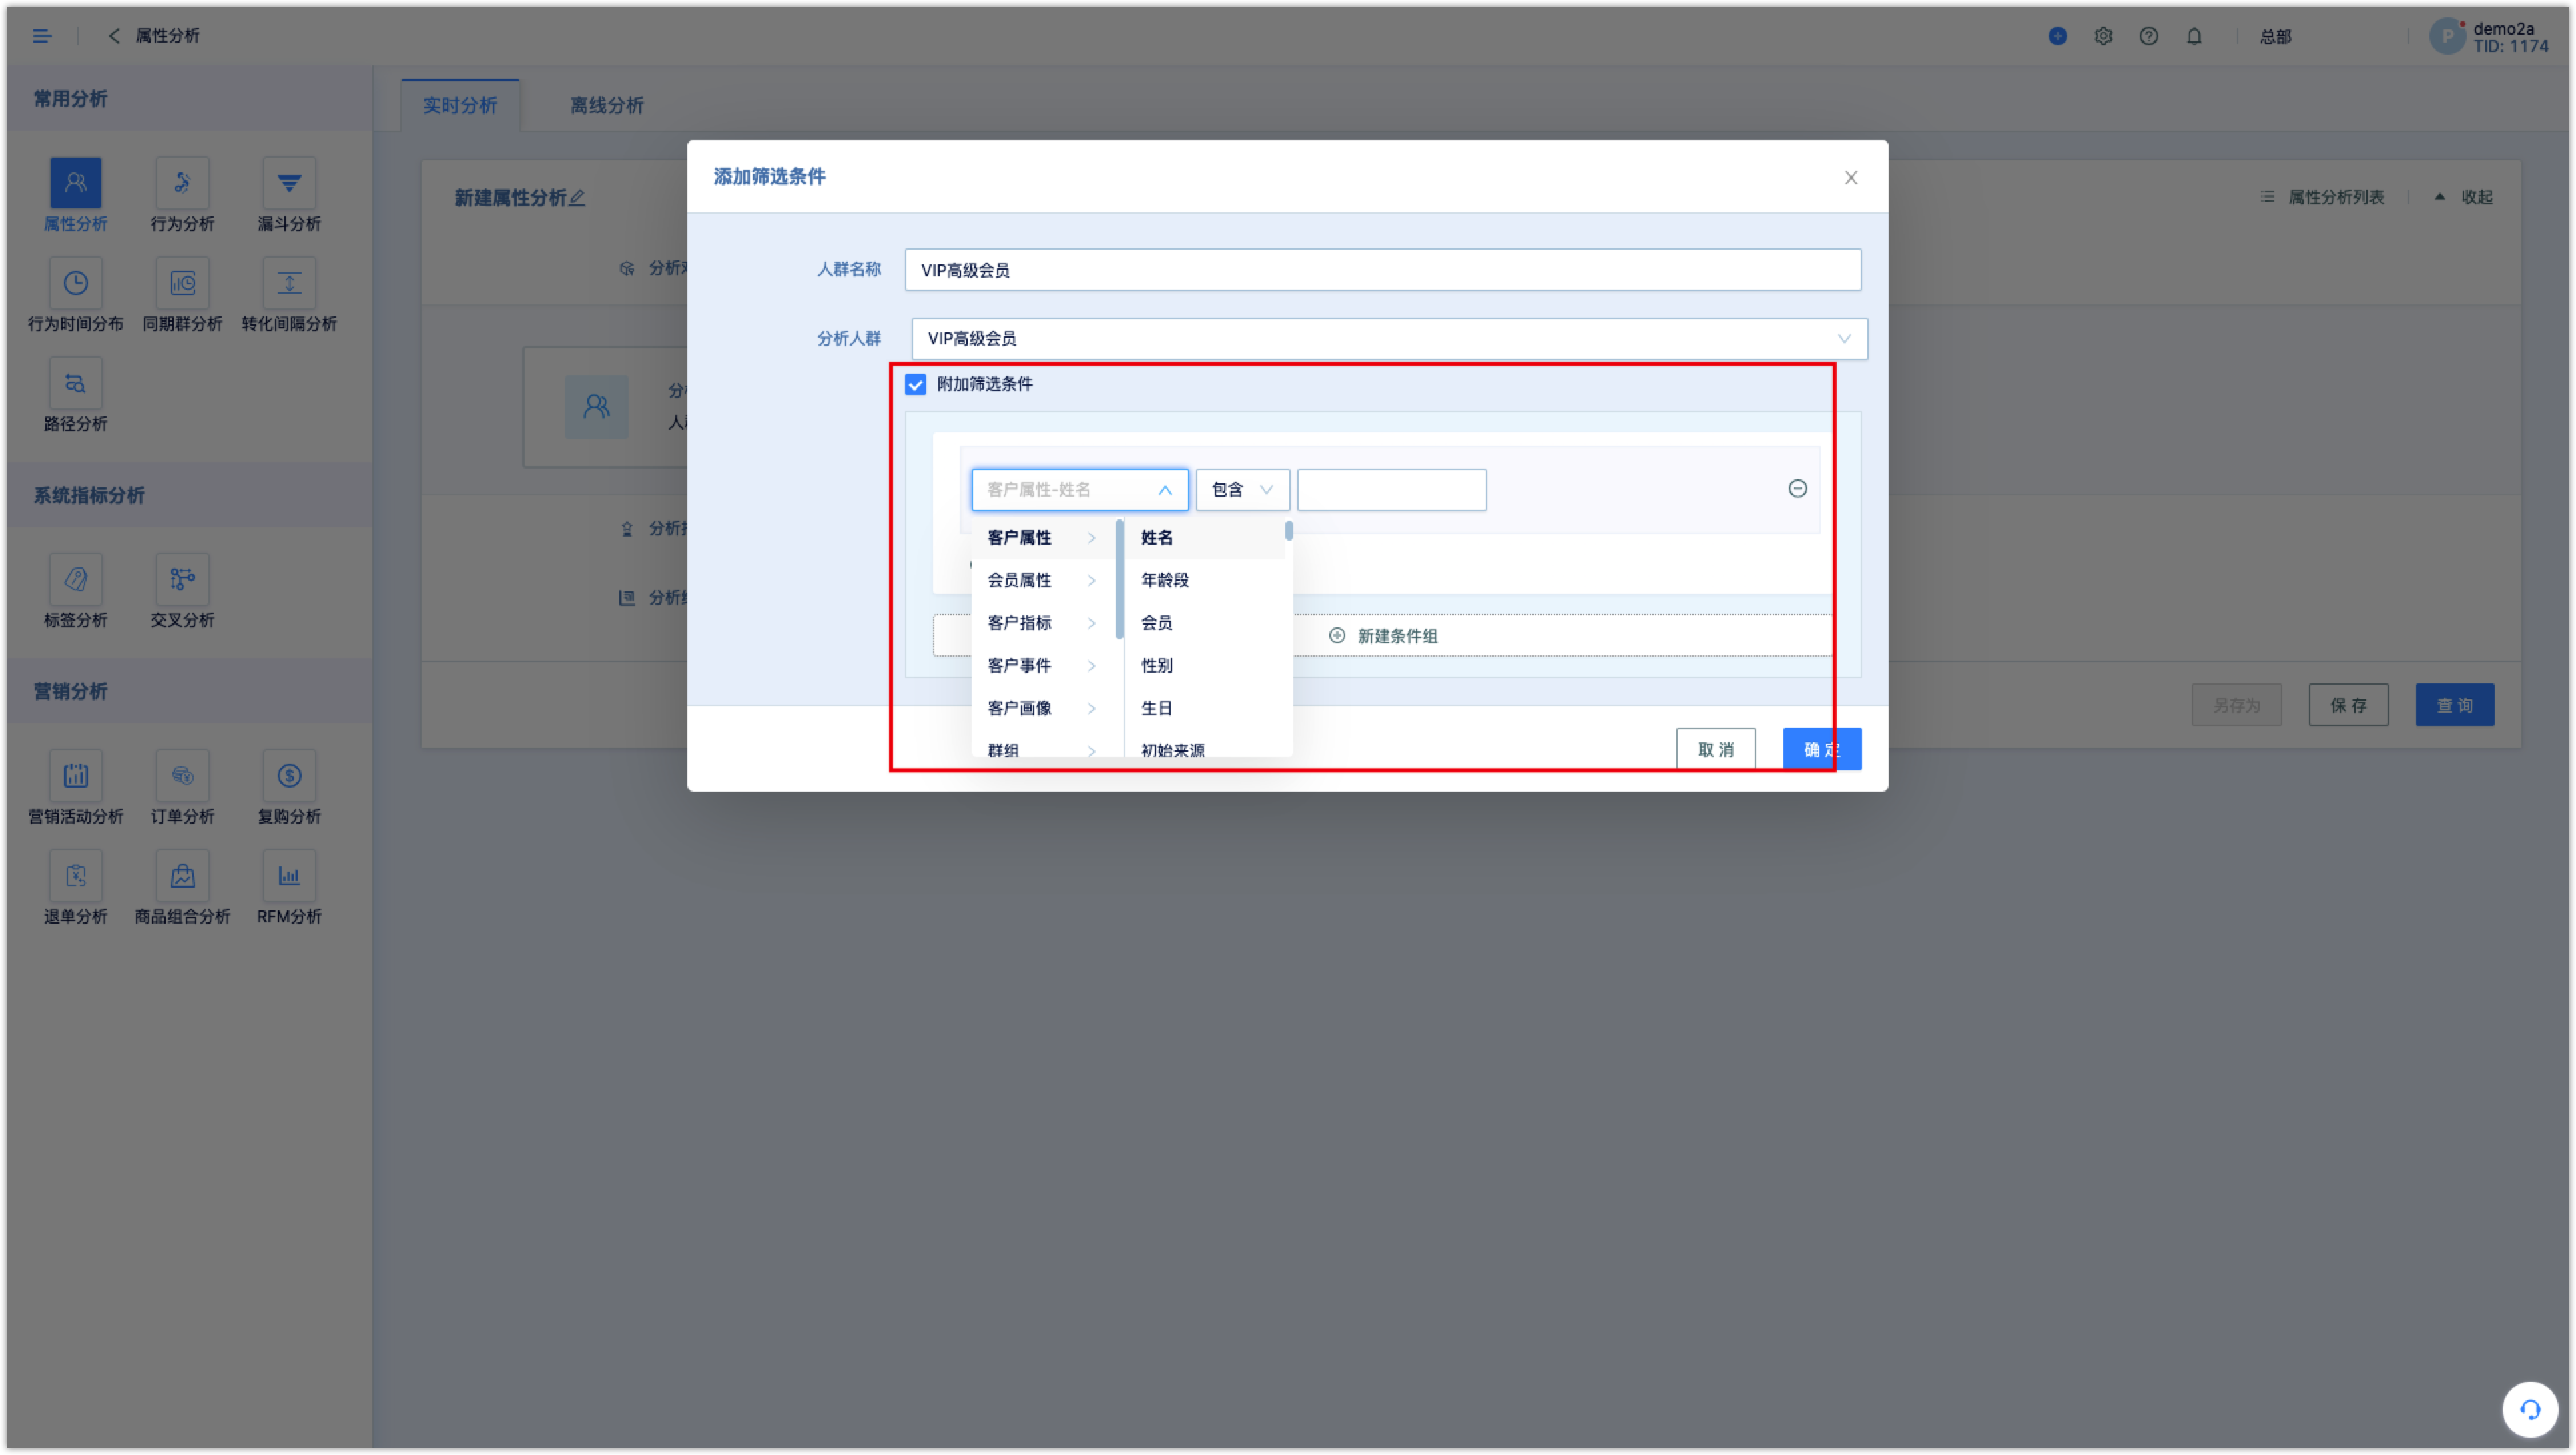
Check the [Attached Filtering Criteria], and then further filter out the analysis population based on the conditions above the selected group.
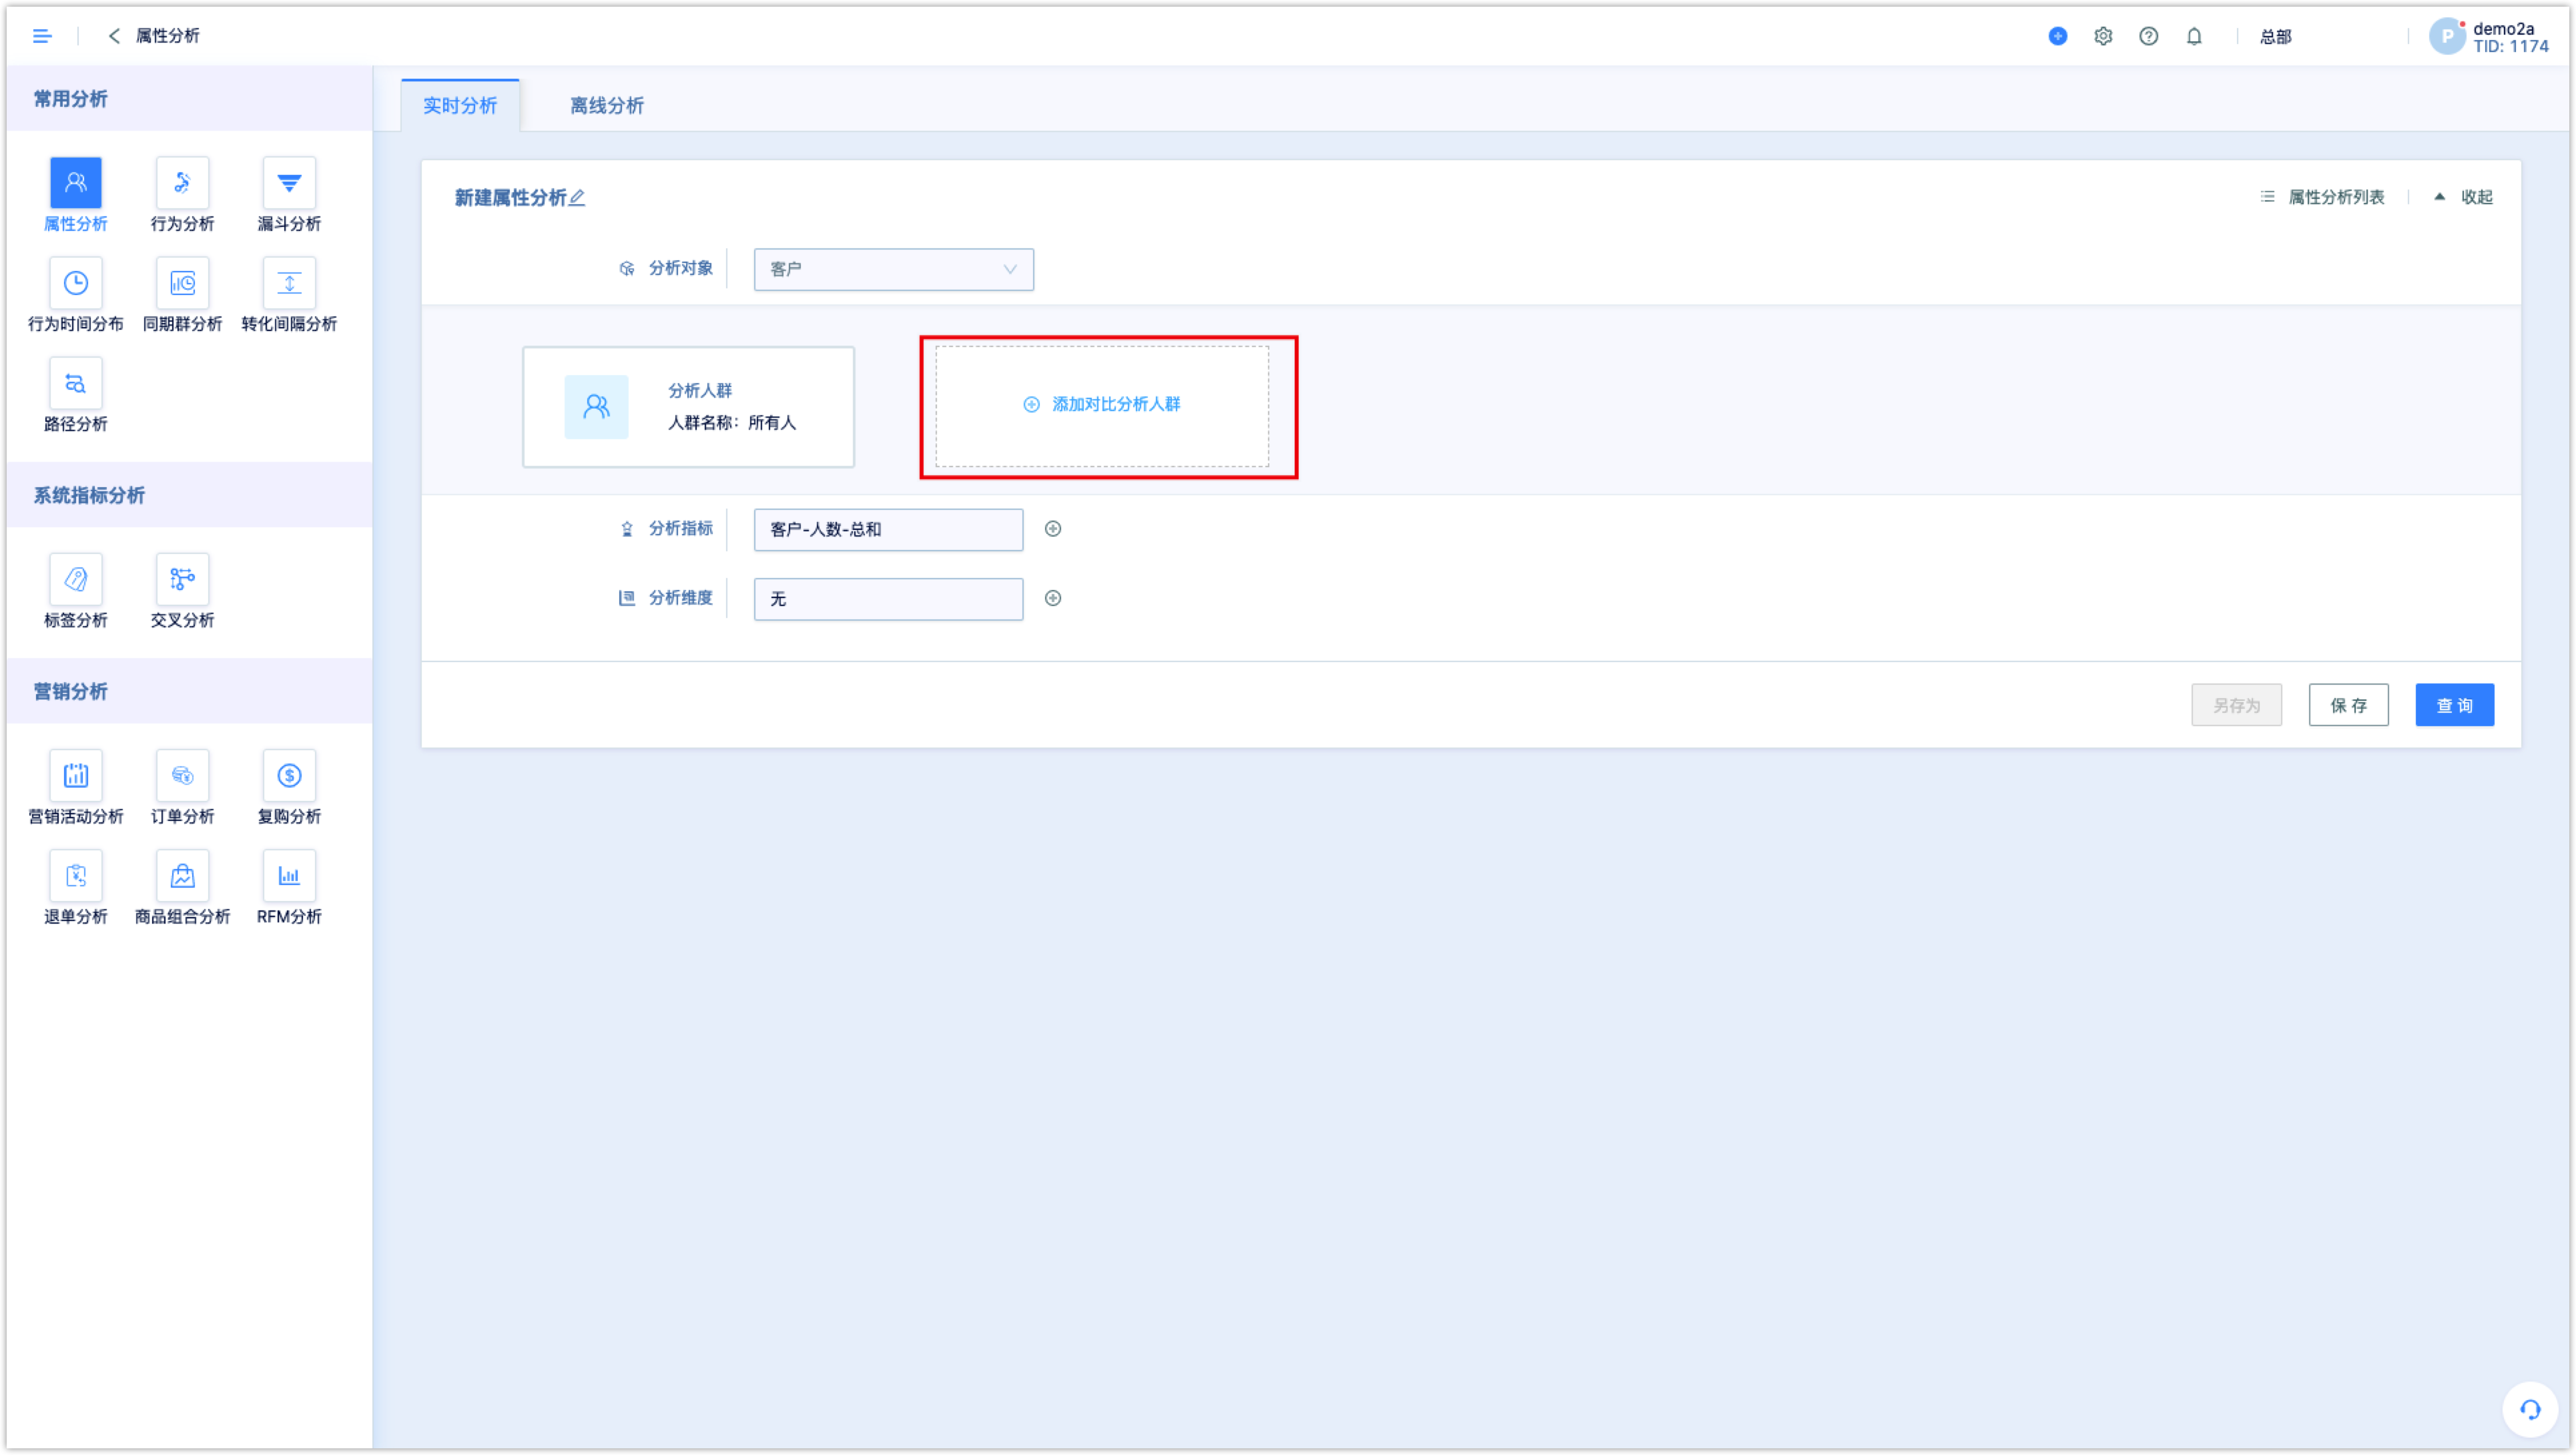
You can also compare and analyze two groups of people at the same time, click [Add Comparison Group] to add a comparison group.
3.2Set the analysis indexes
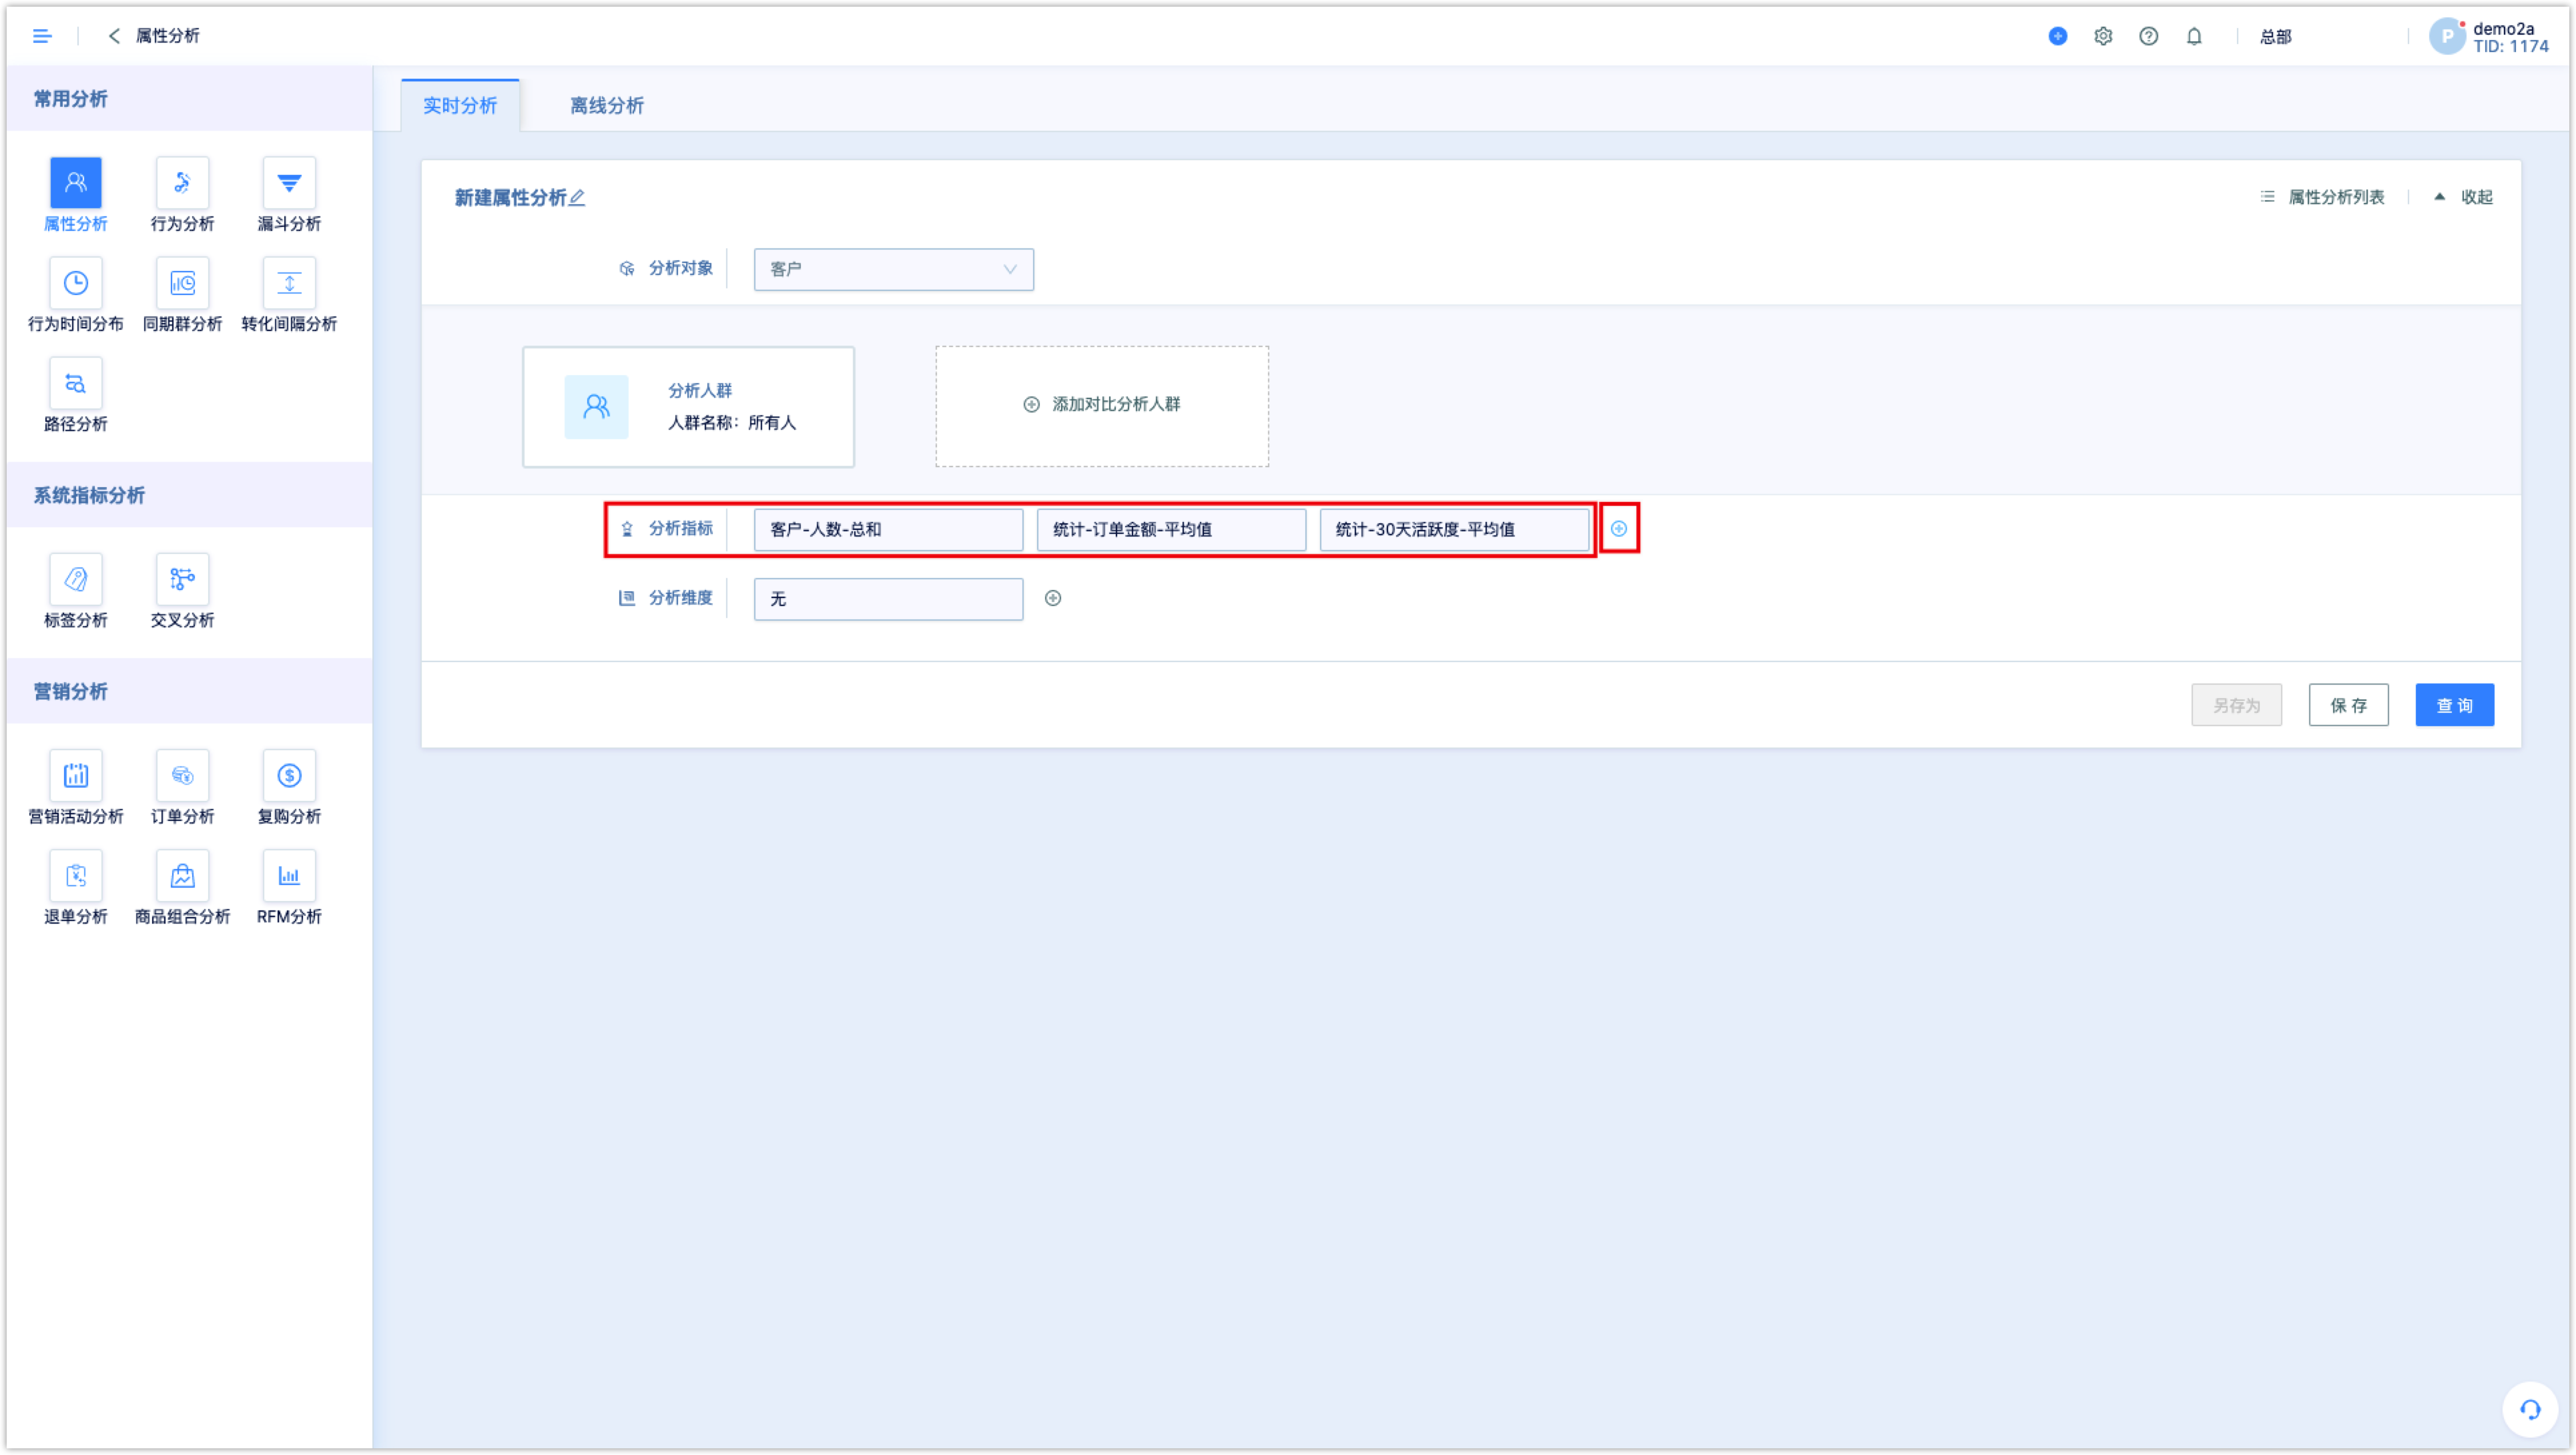
Analysis indicators can be regarded as the Y-axis of an analysis chart, that is, what data of the analyzed group needs to be viewed, such as the total number of people, the average activity level, the total order amount, and so on. The available options are all numeric attributes or statistical customer indicators. The most commonly used index is [number of people], which can analyze the number of people by dimensions.
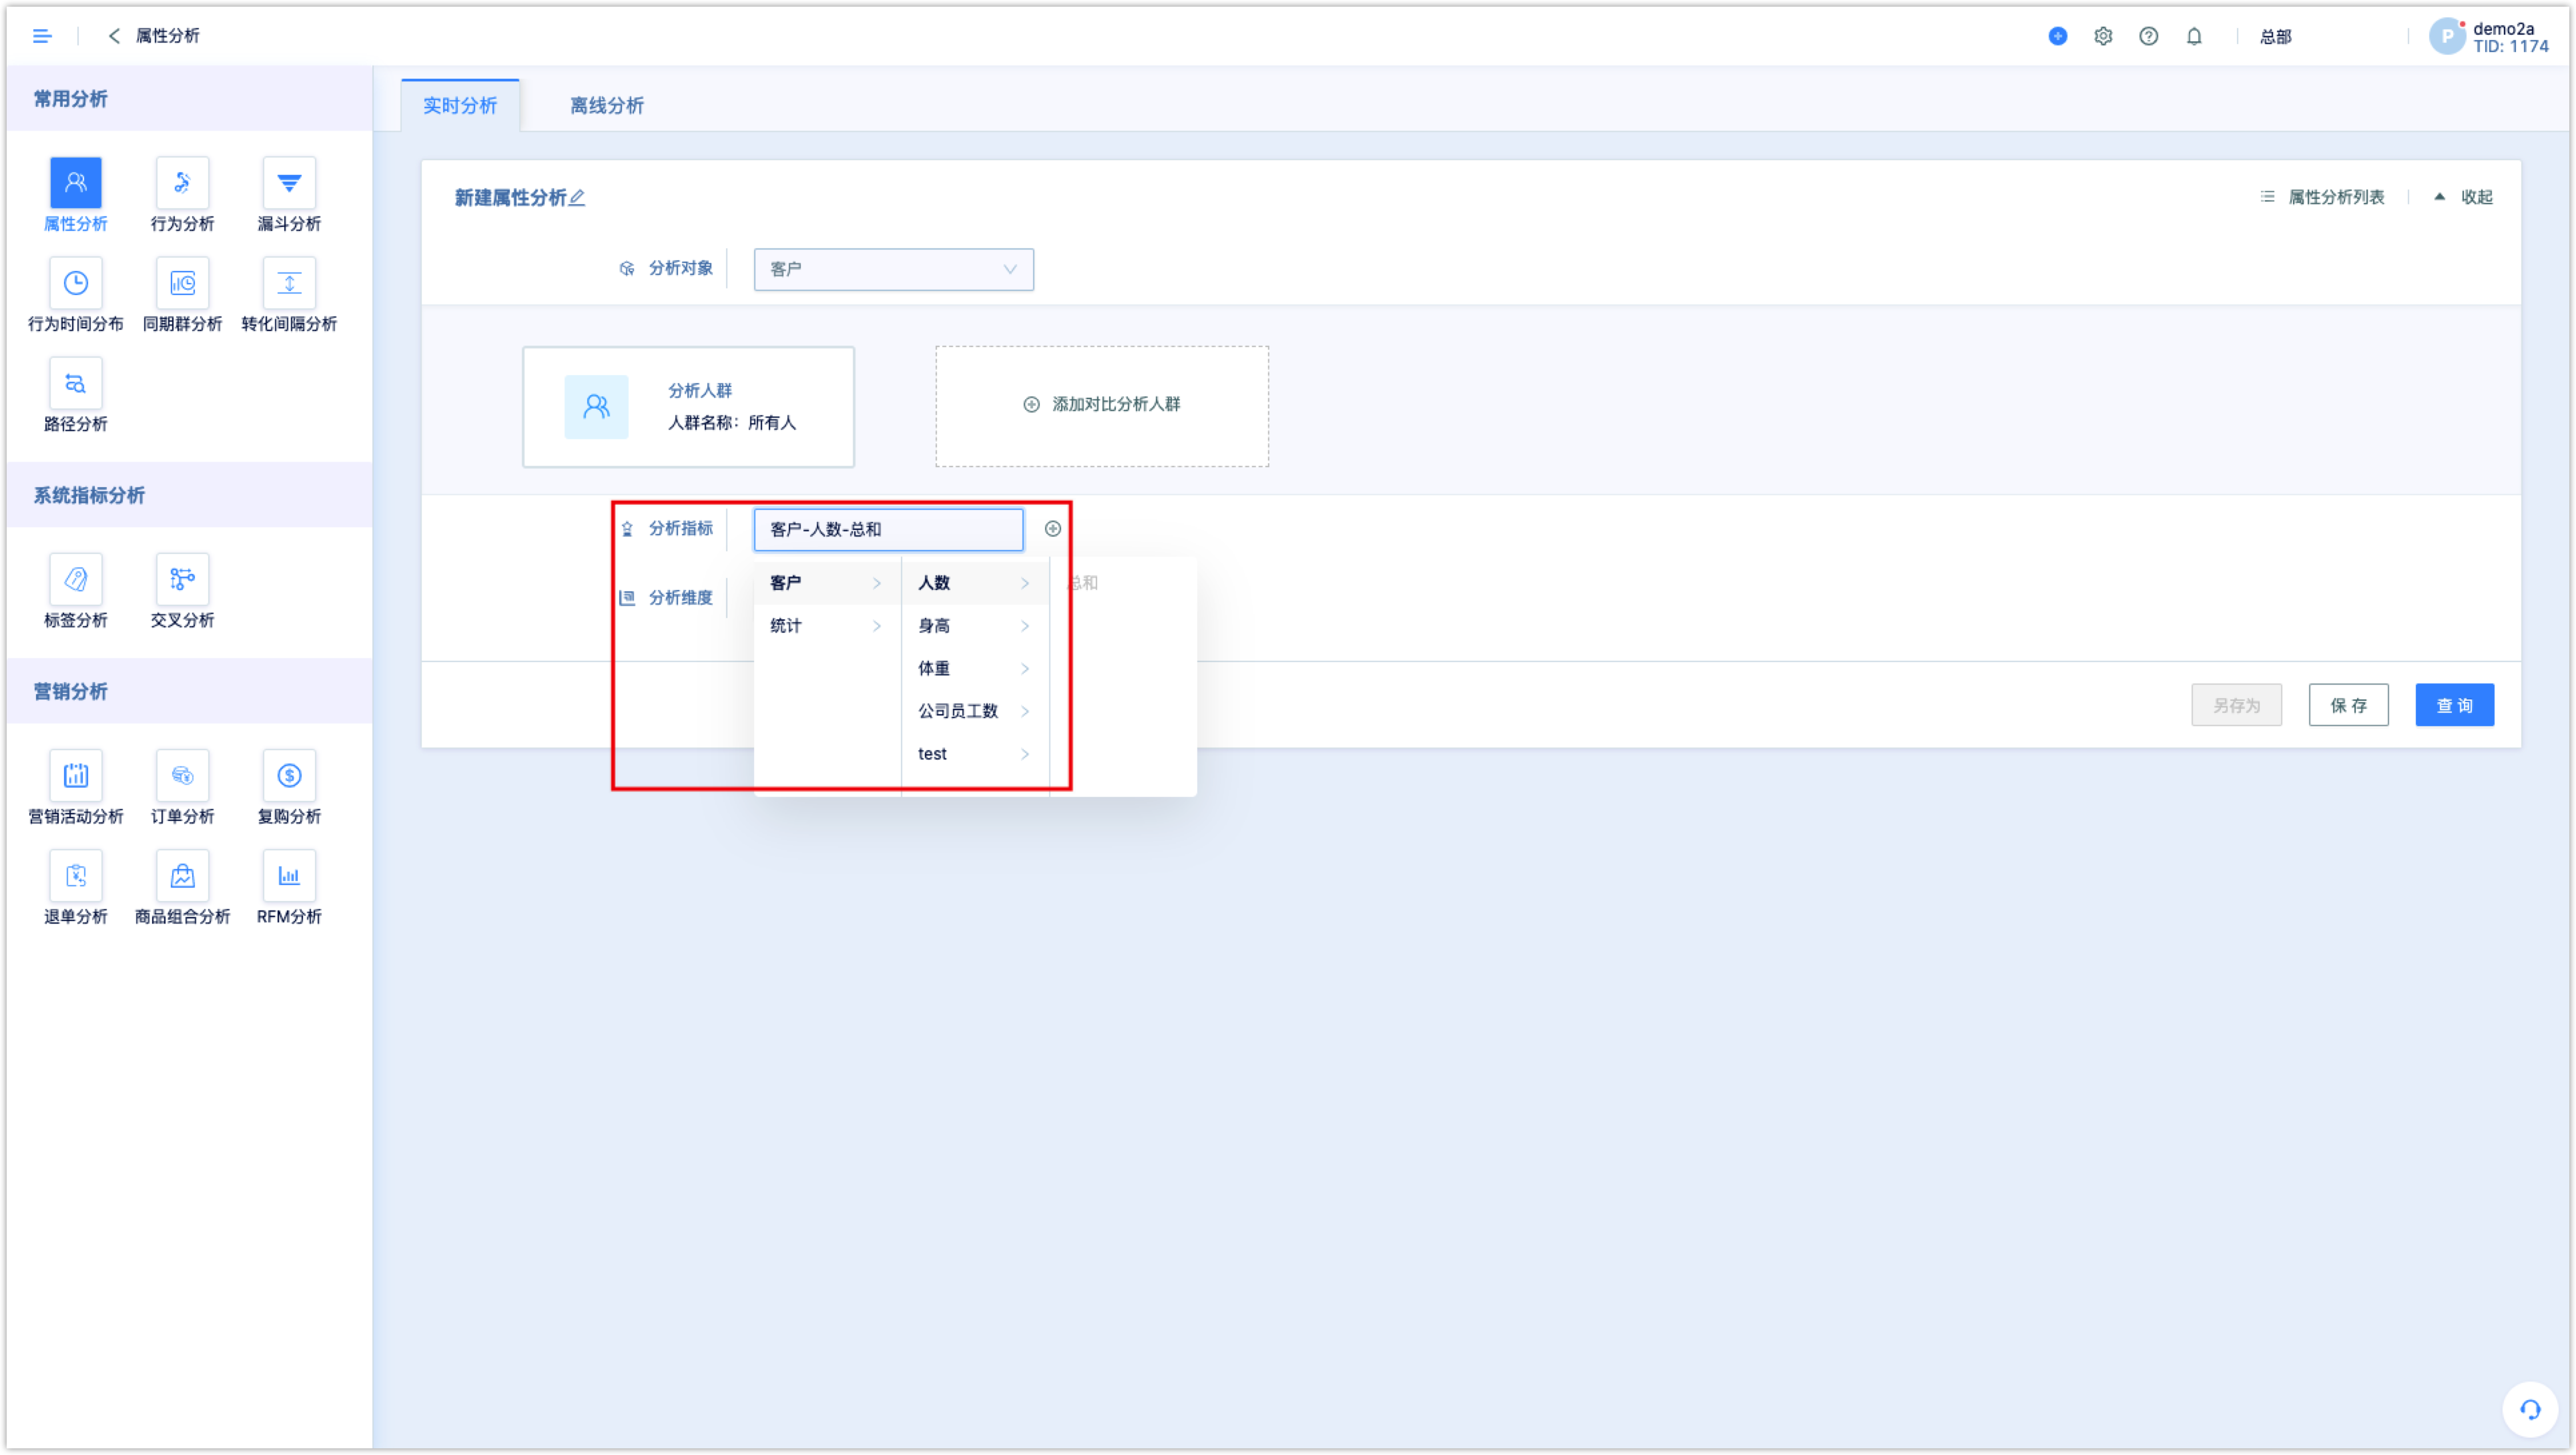
Multiple analysis indexes can be added, up to four.
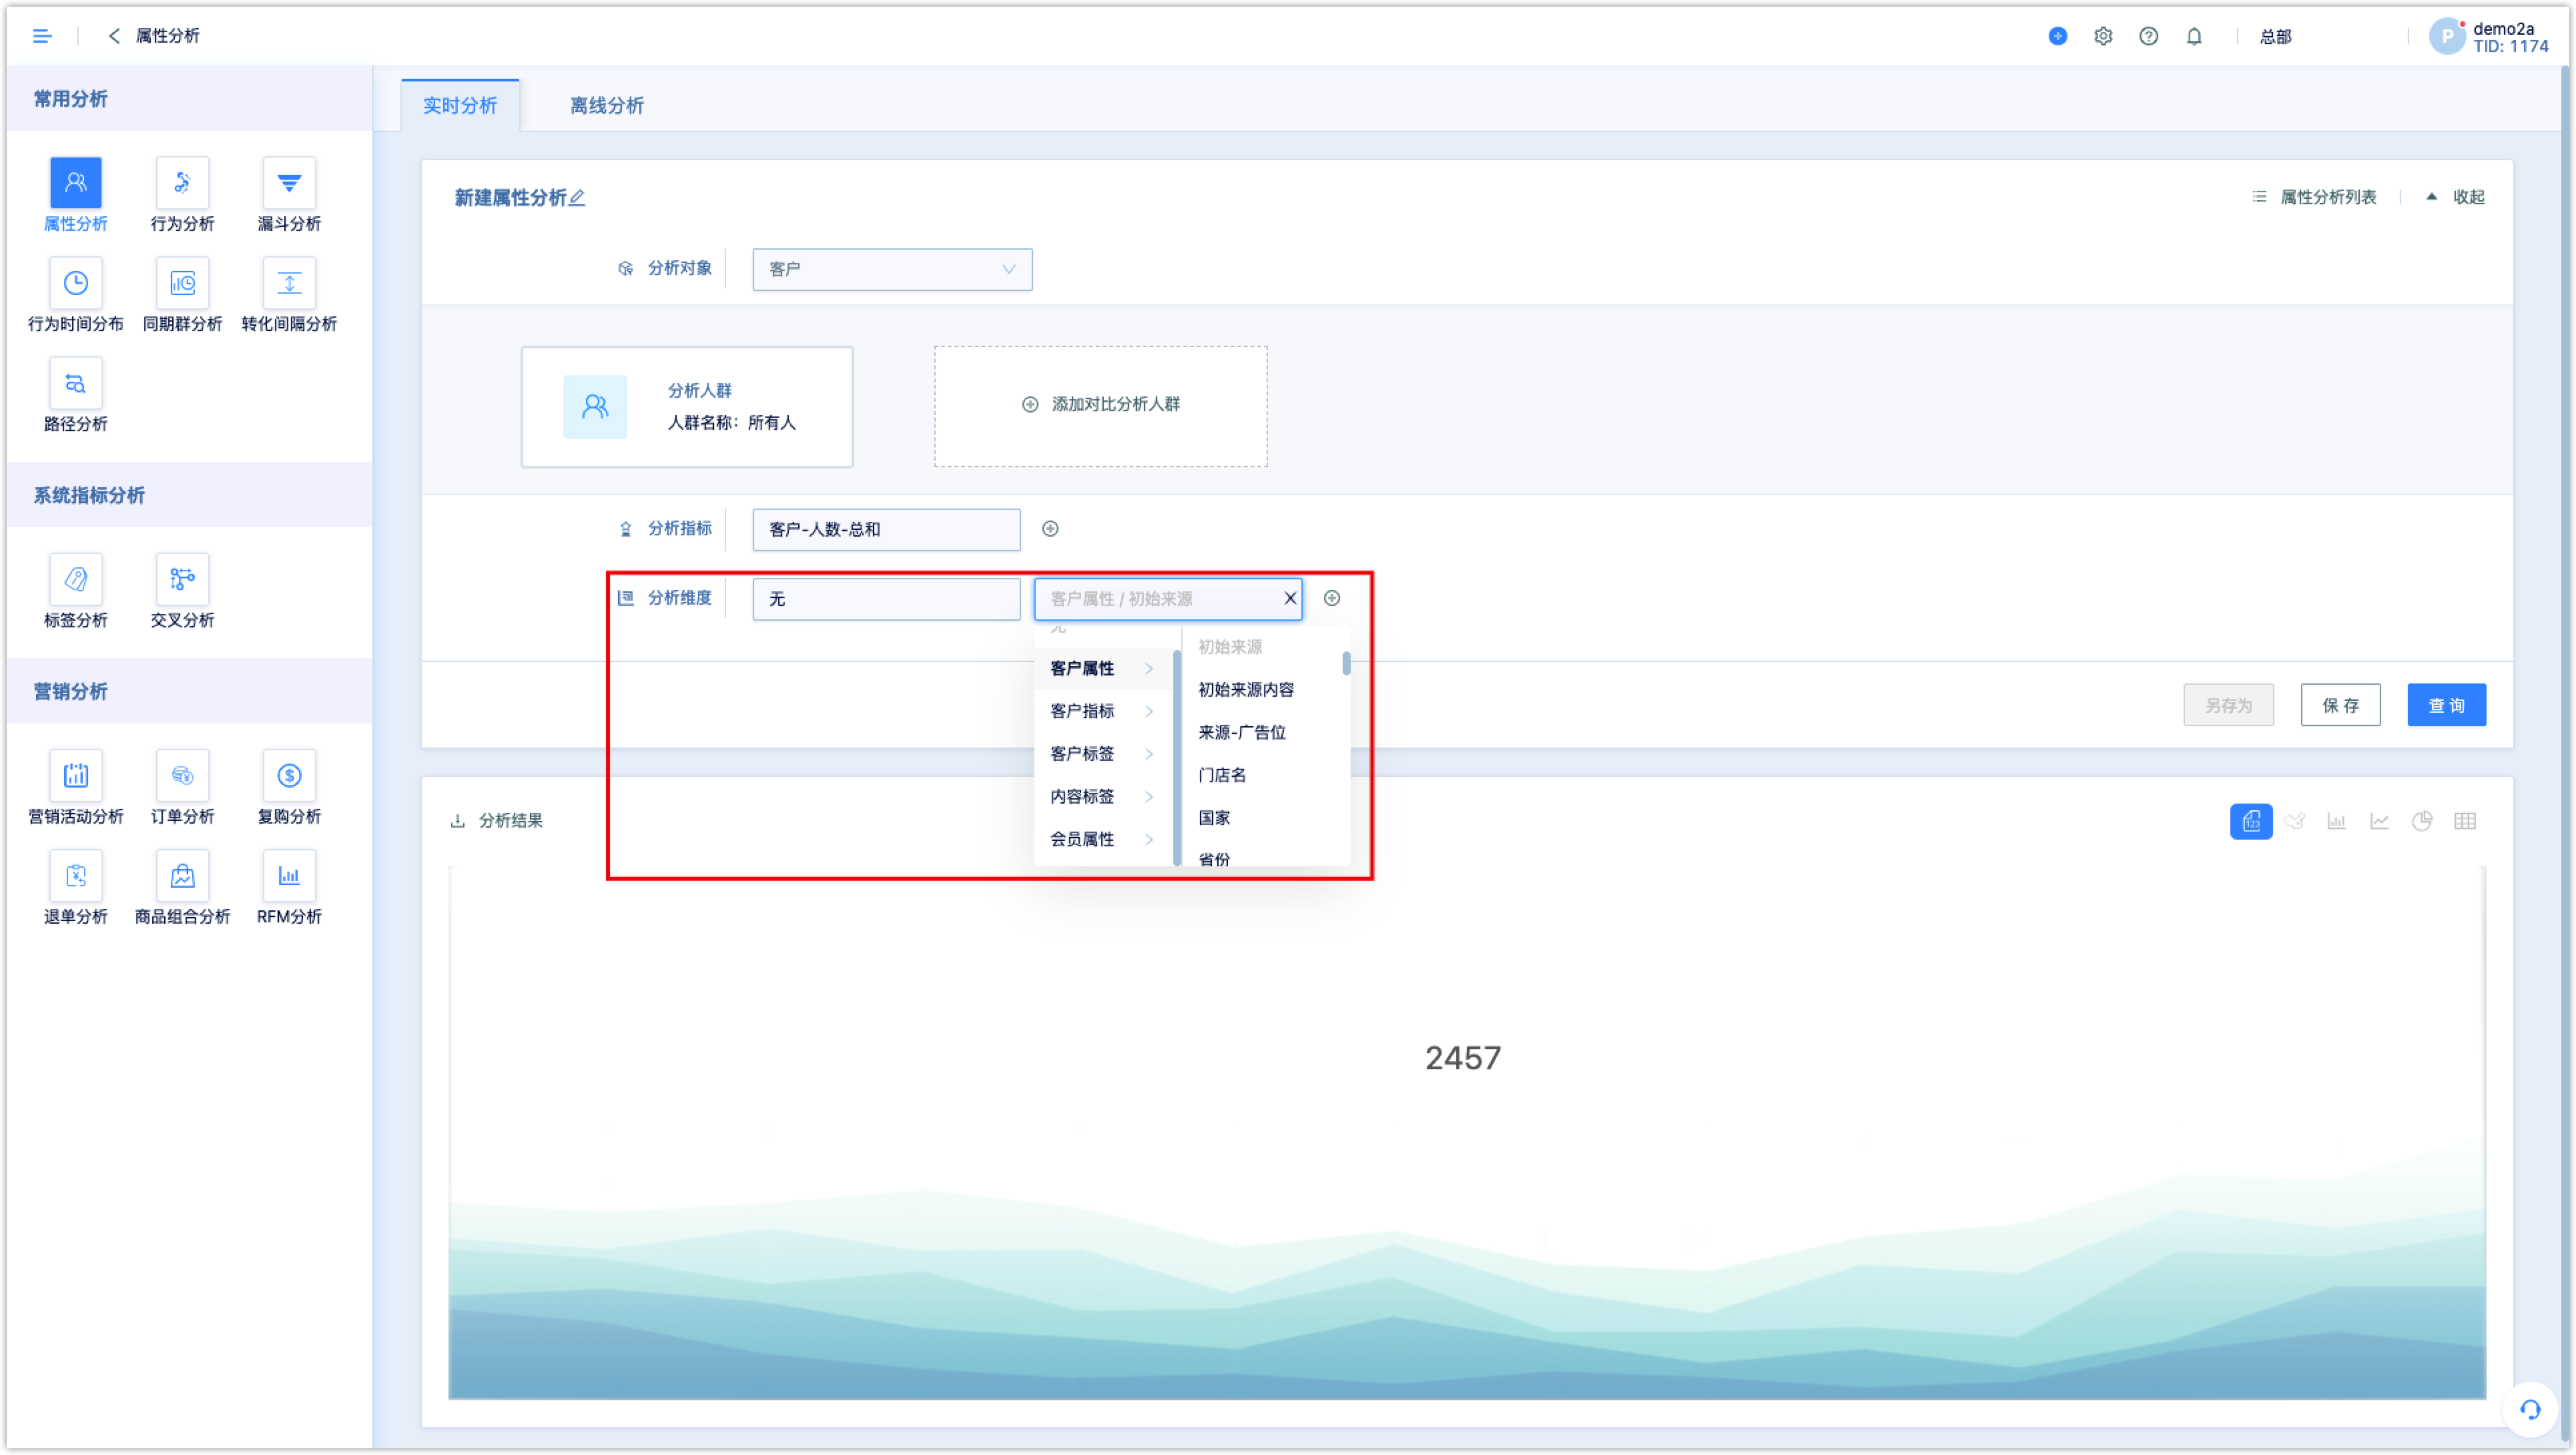
3.3Set analysis dimension
The analysis dimension can be regarded as the X axis of an analysis chart, that is, customers can be divided according to customer attributes or indexes. Options include customer attributes, customer indexes, customer tags, etc. Up to 4 dimensions can be added.
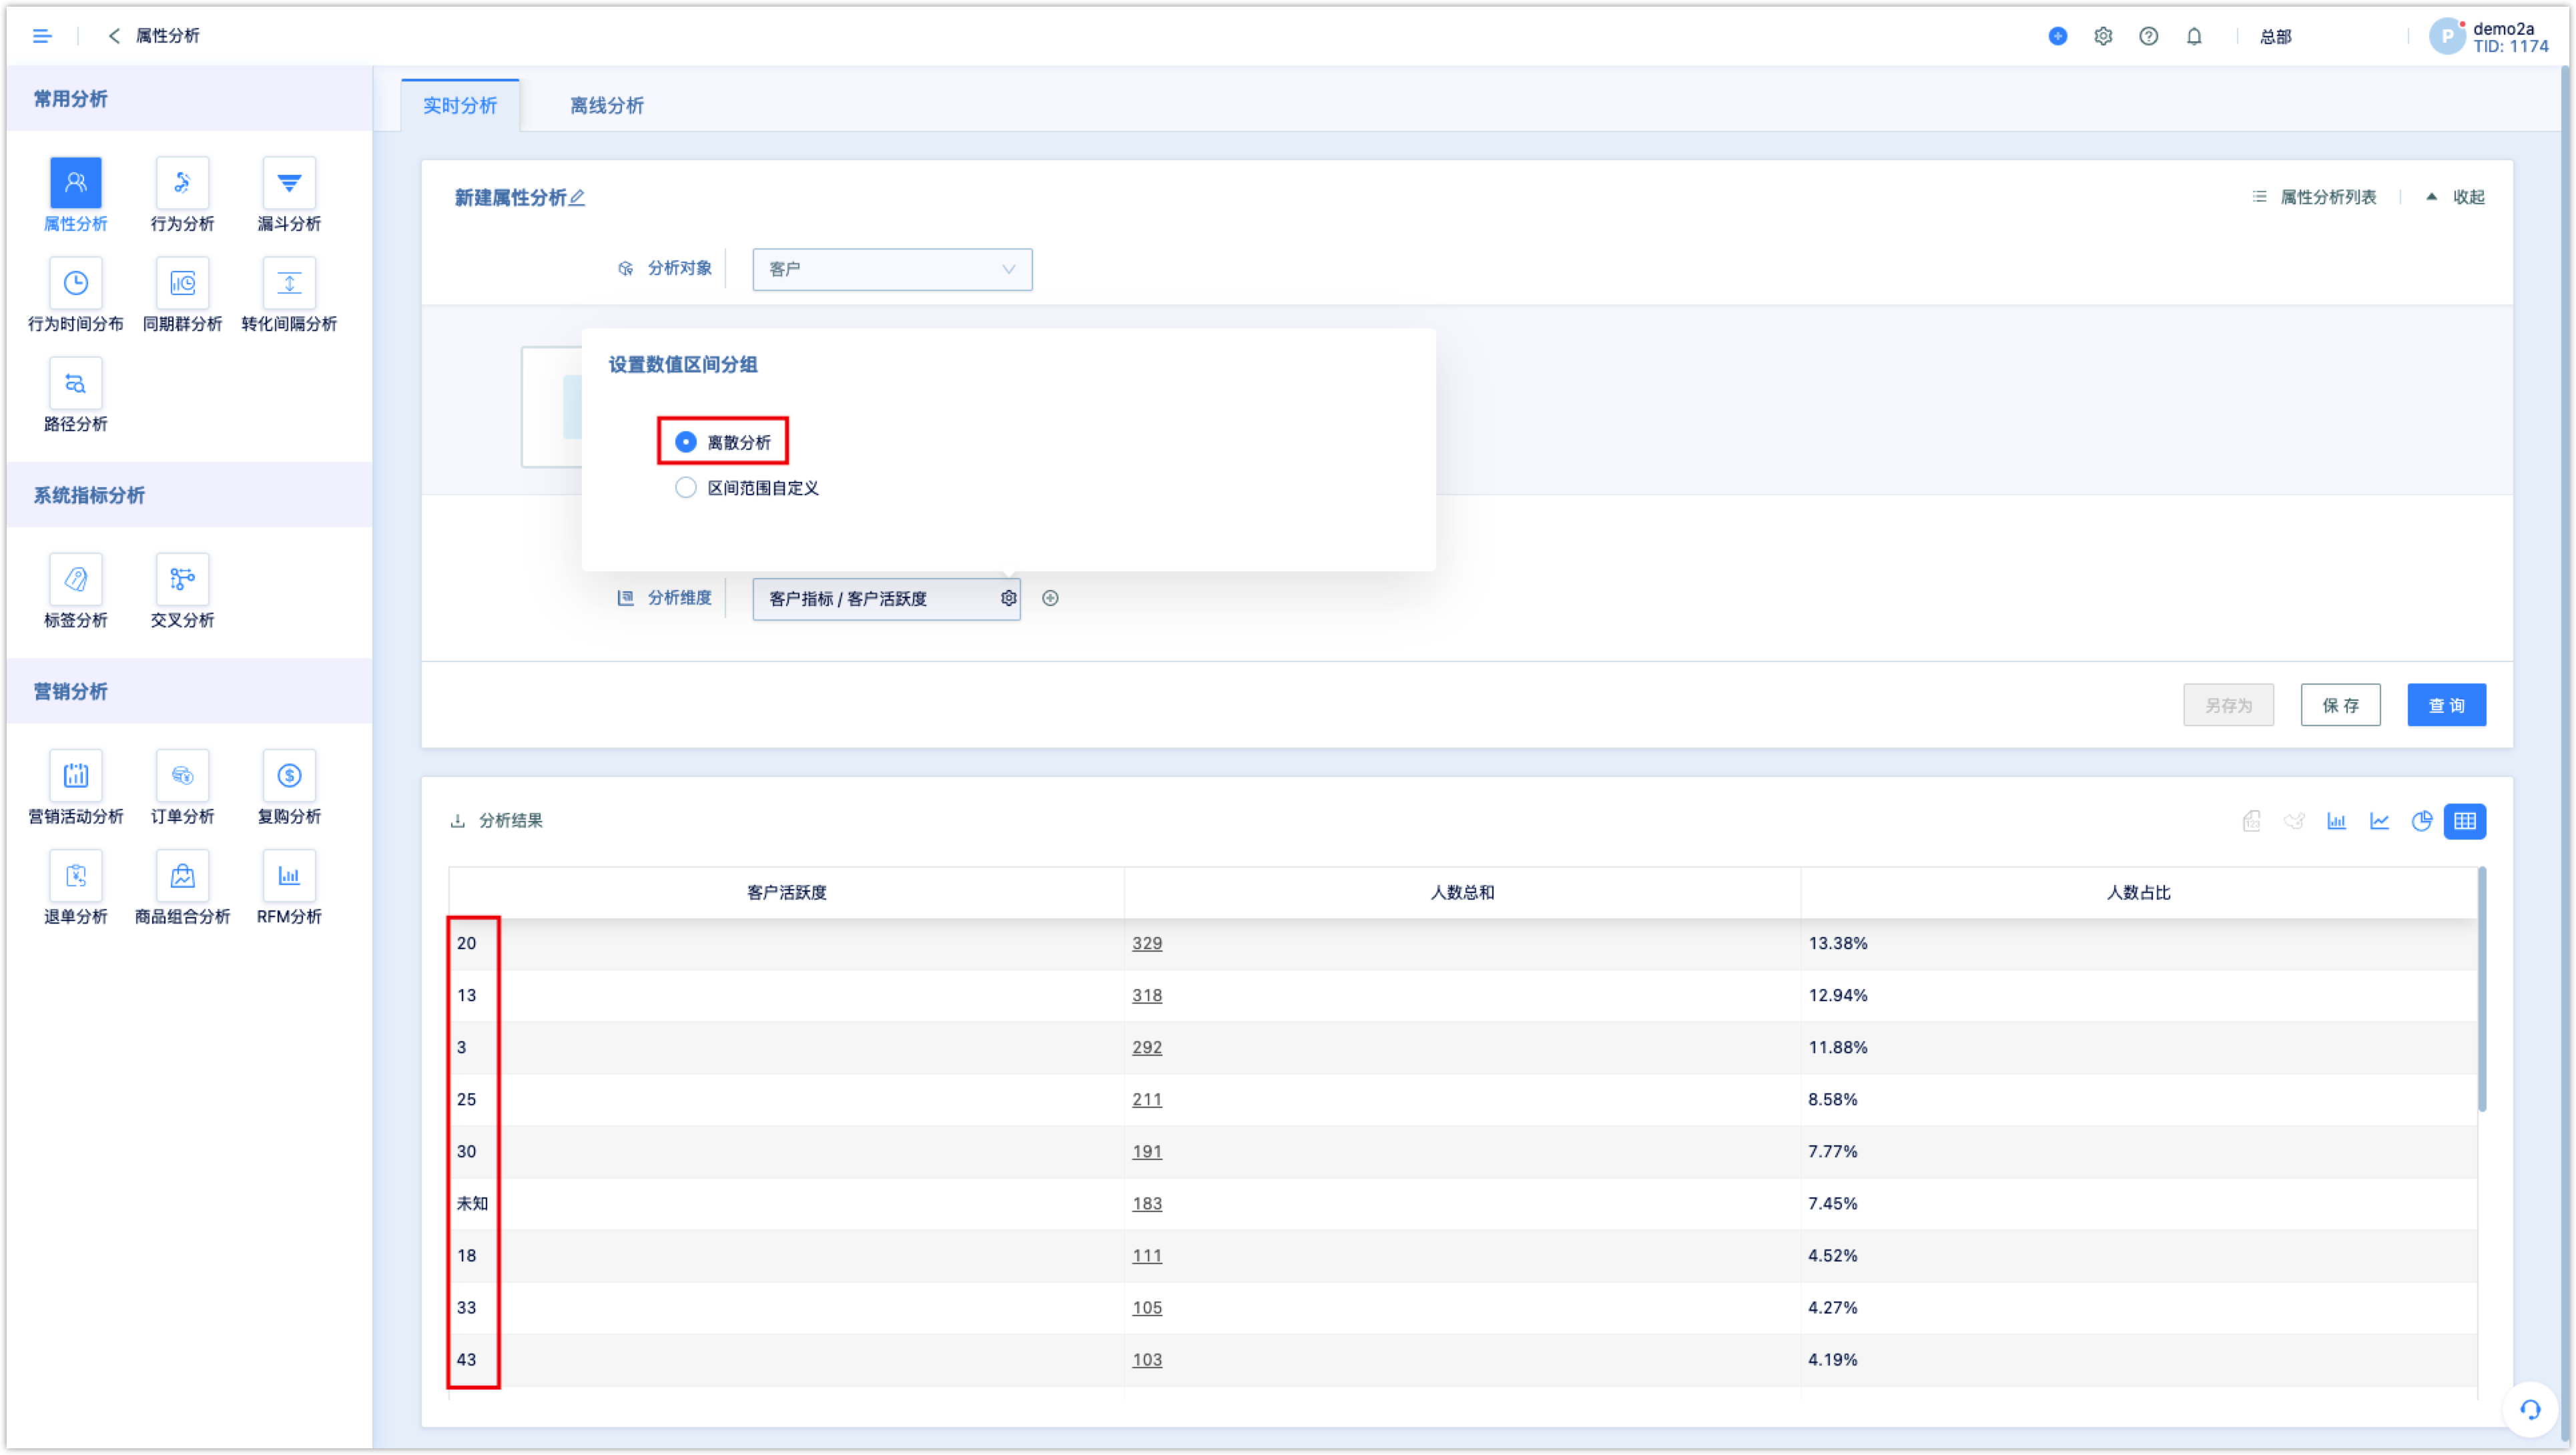
If the analysis dimension is a numerical type, you can set the form of numerical interval grouping.
- Discrete analysis: each value is a dimension
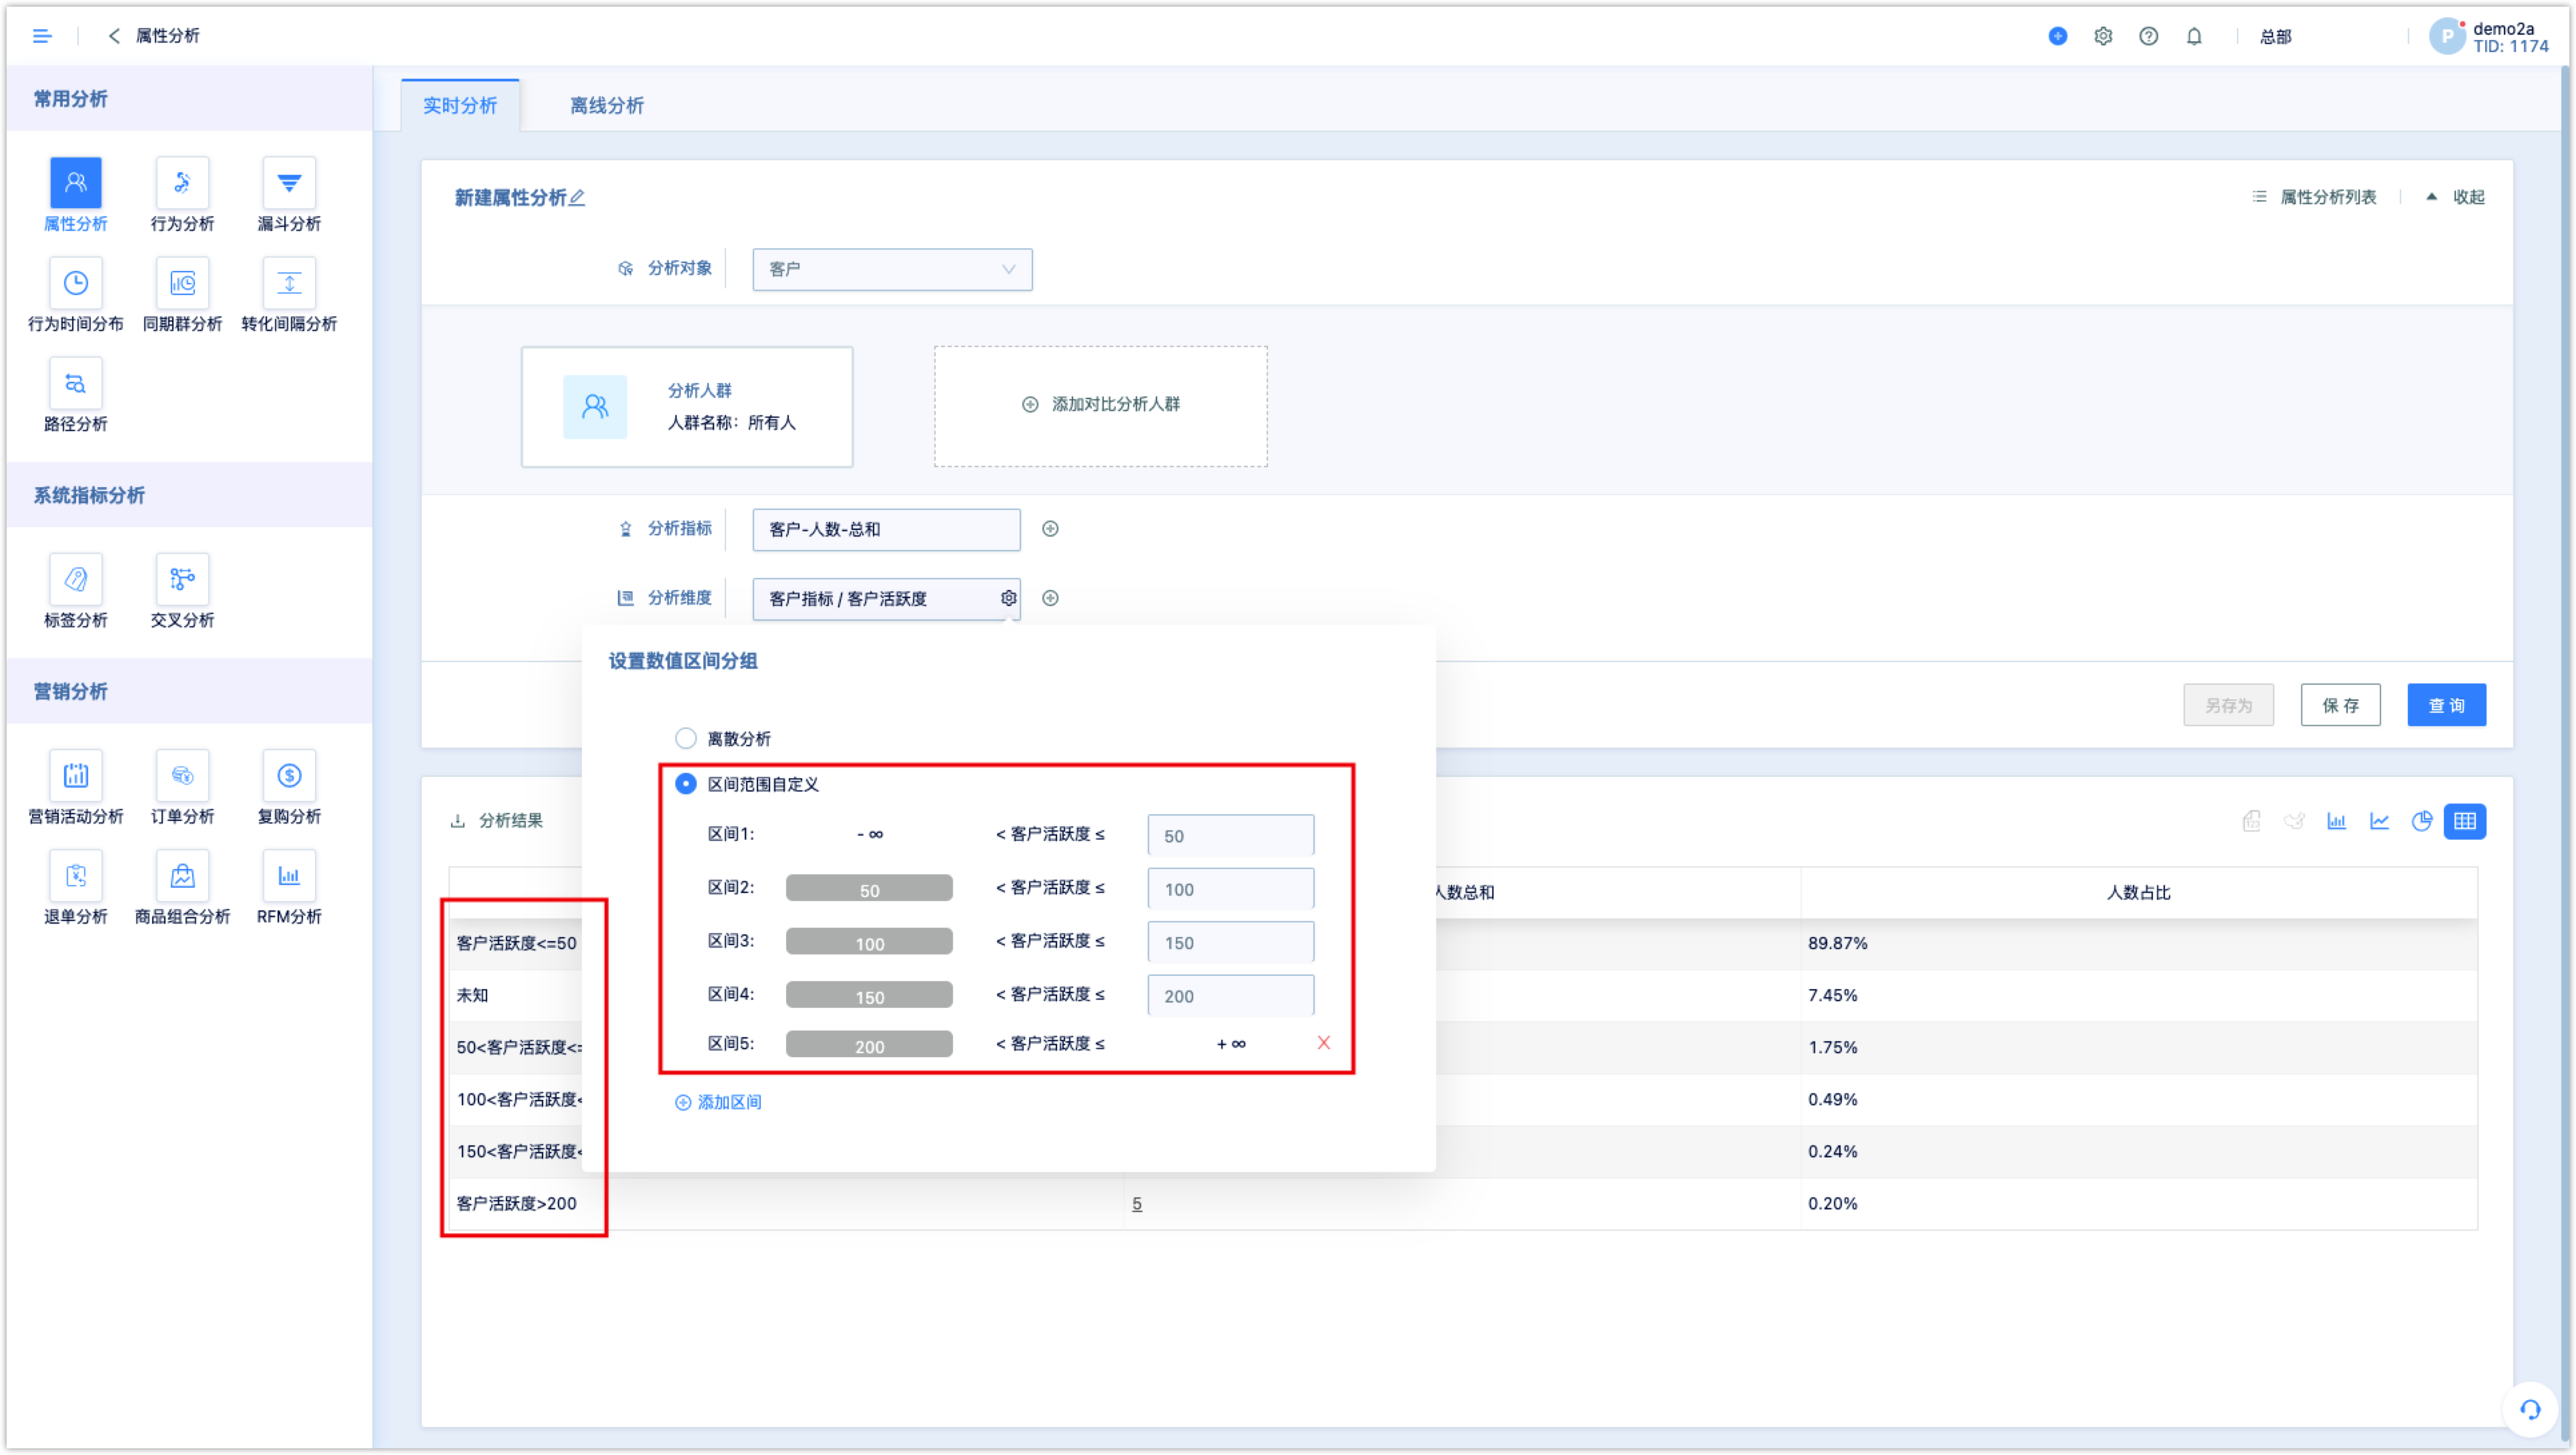
- Custom interval range: define several intervals, each interval is a dimension
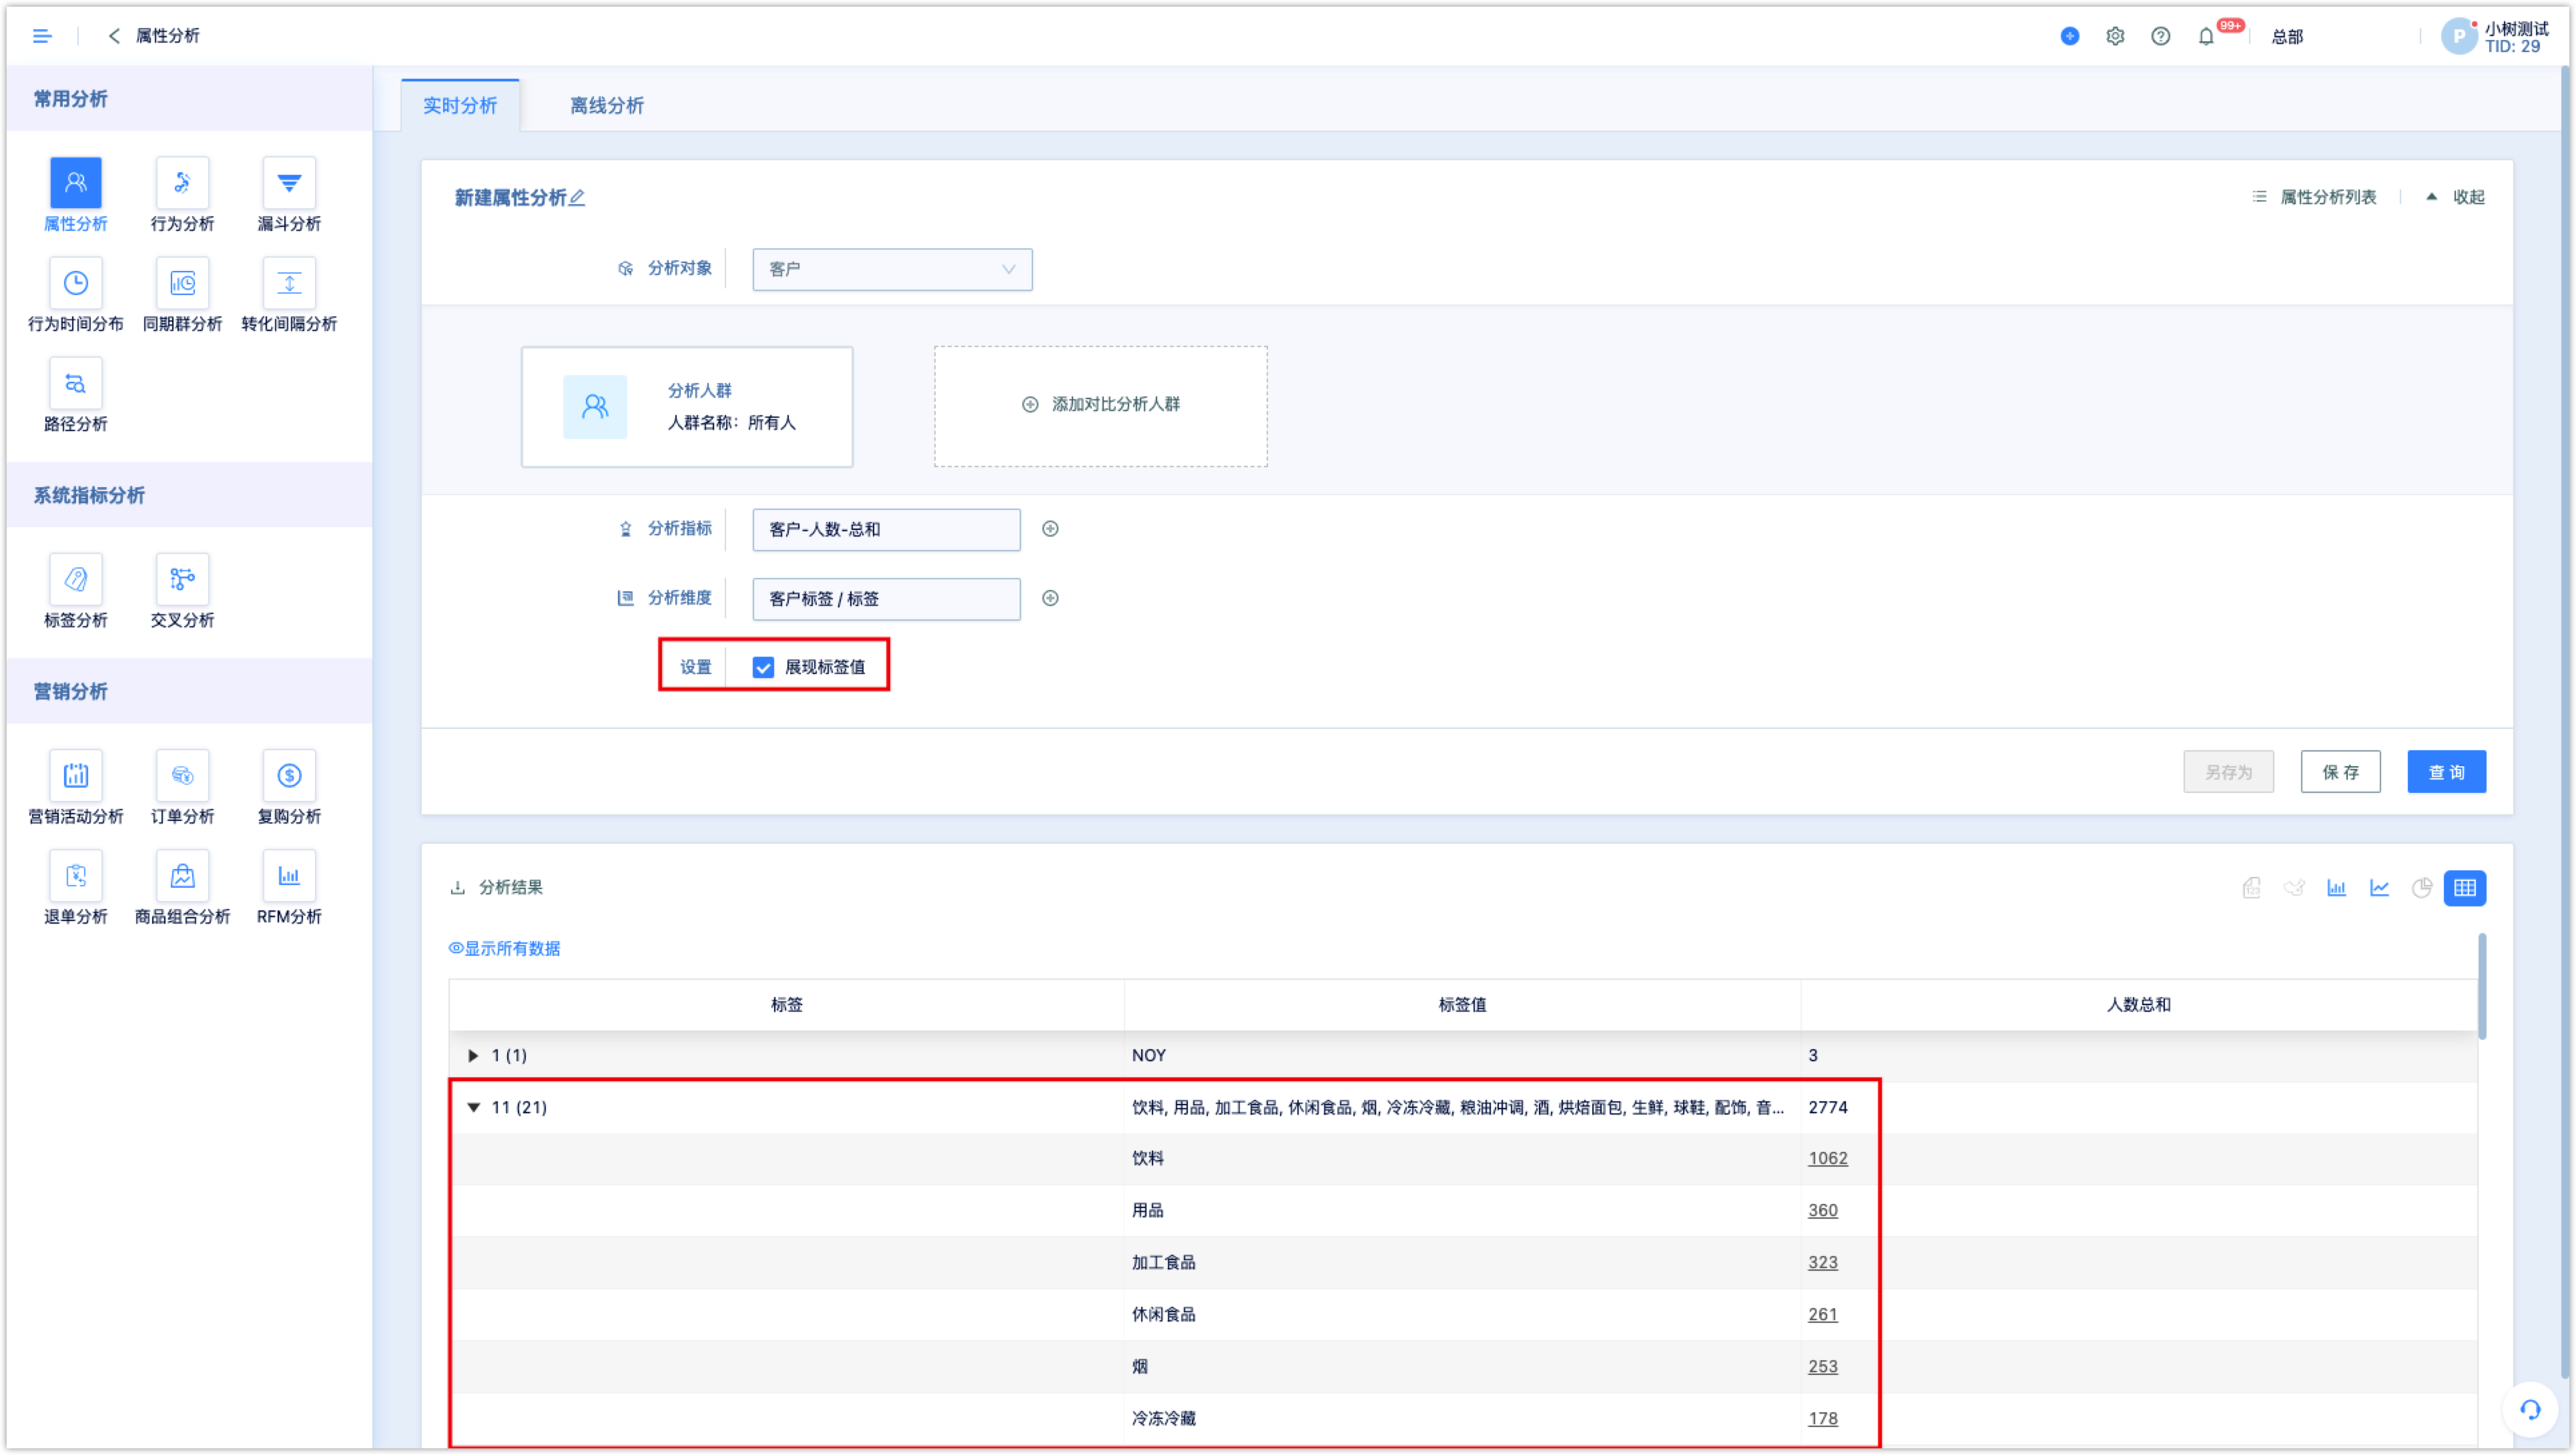
If the analysis dimension is customer tag and there is a value tag in the customer tag, you can choose to display the tag value.
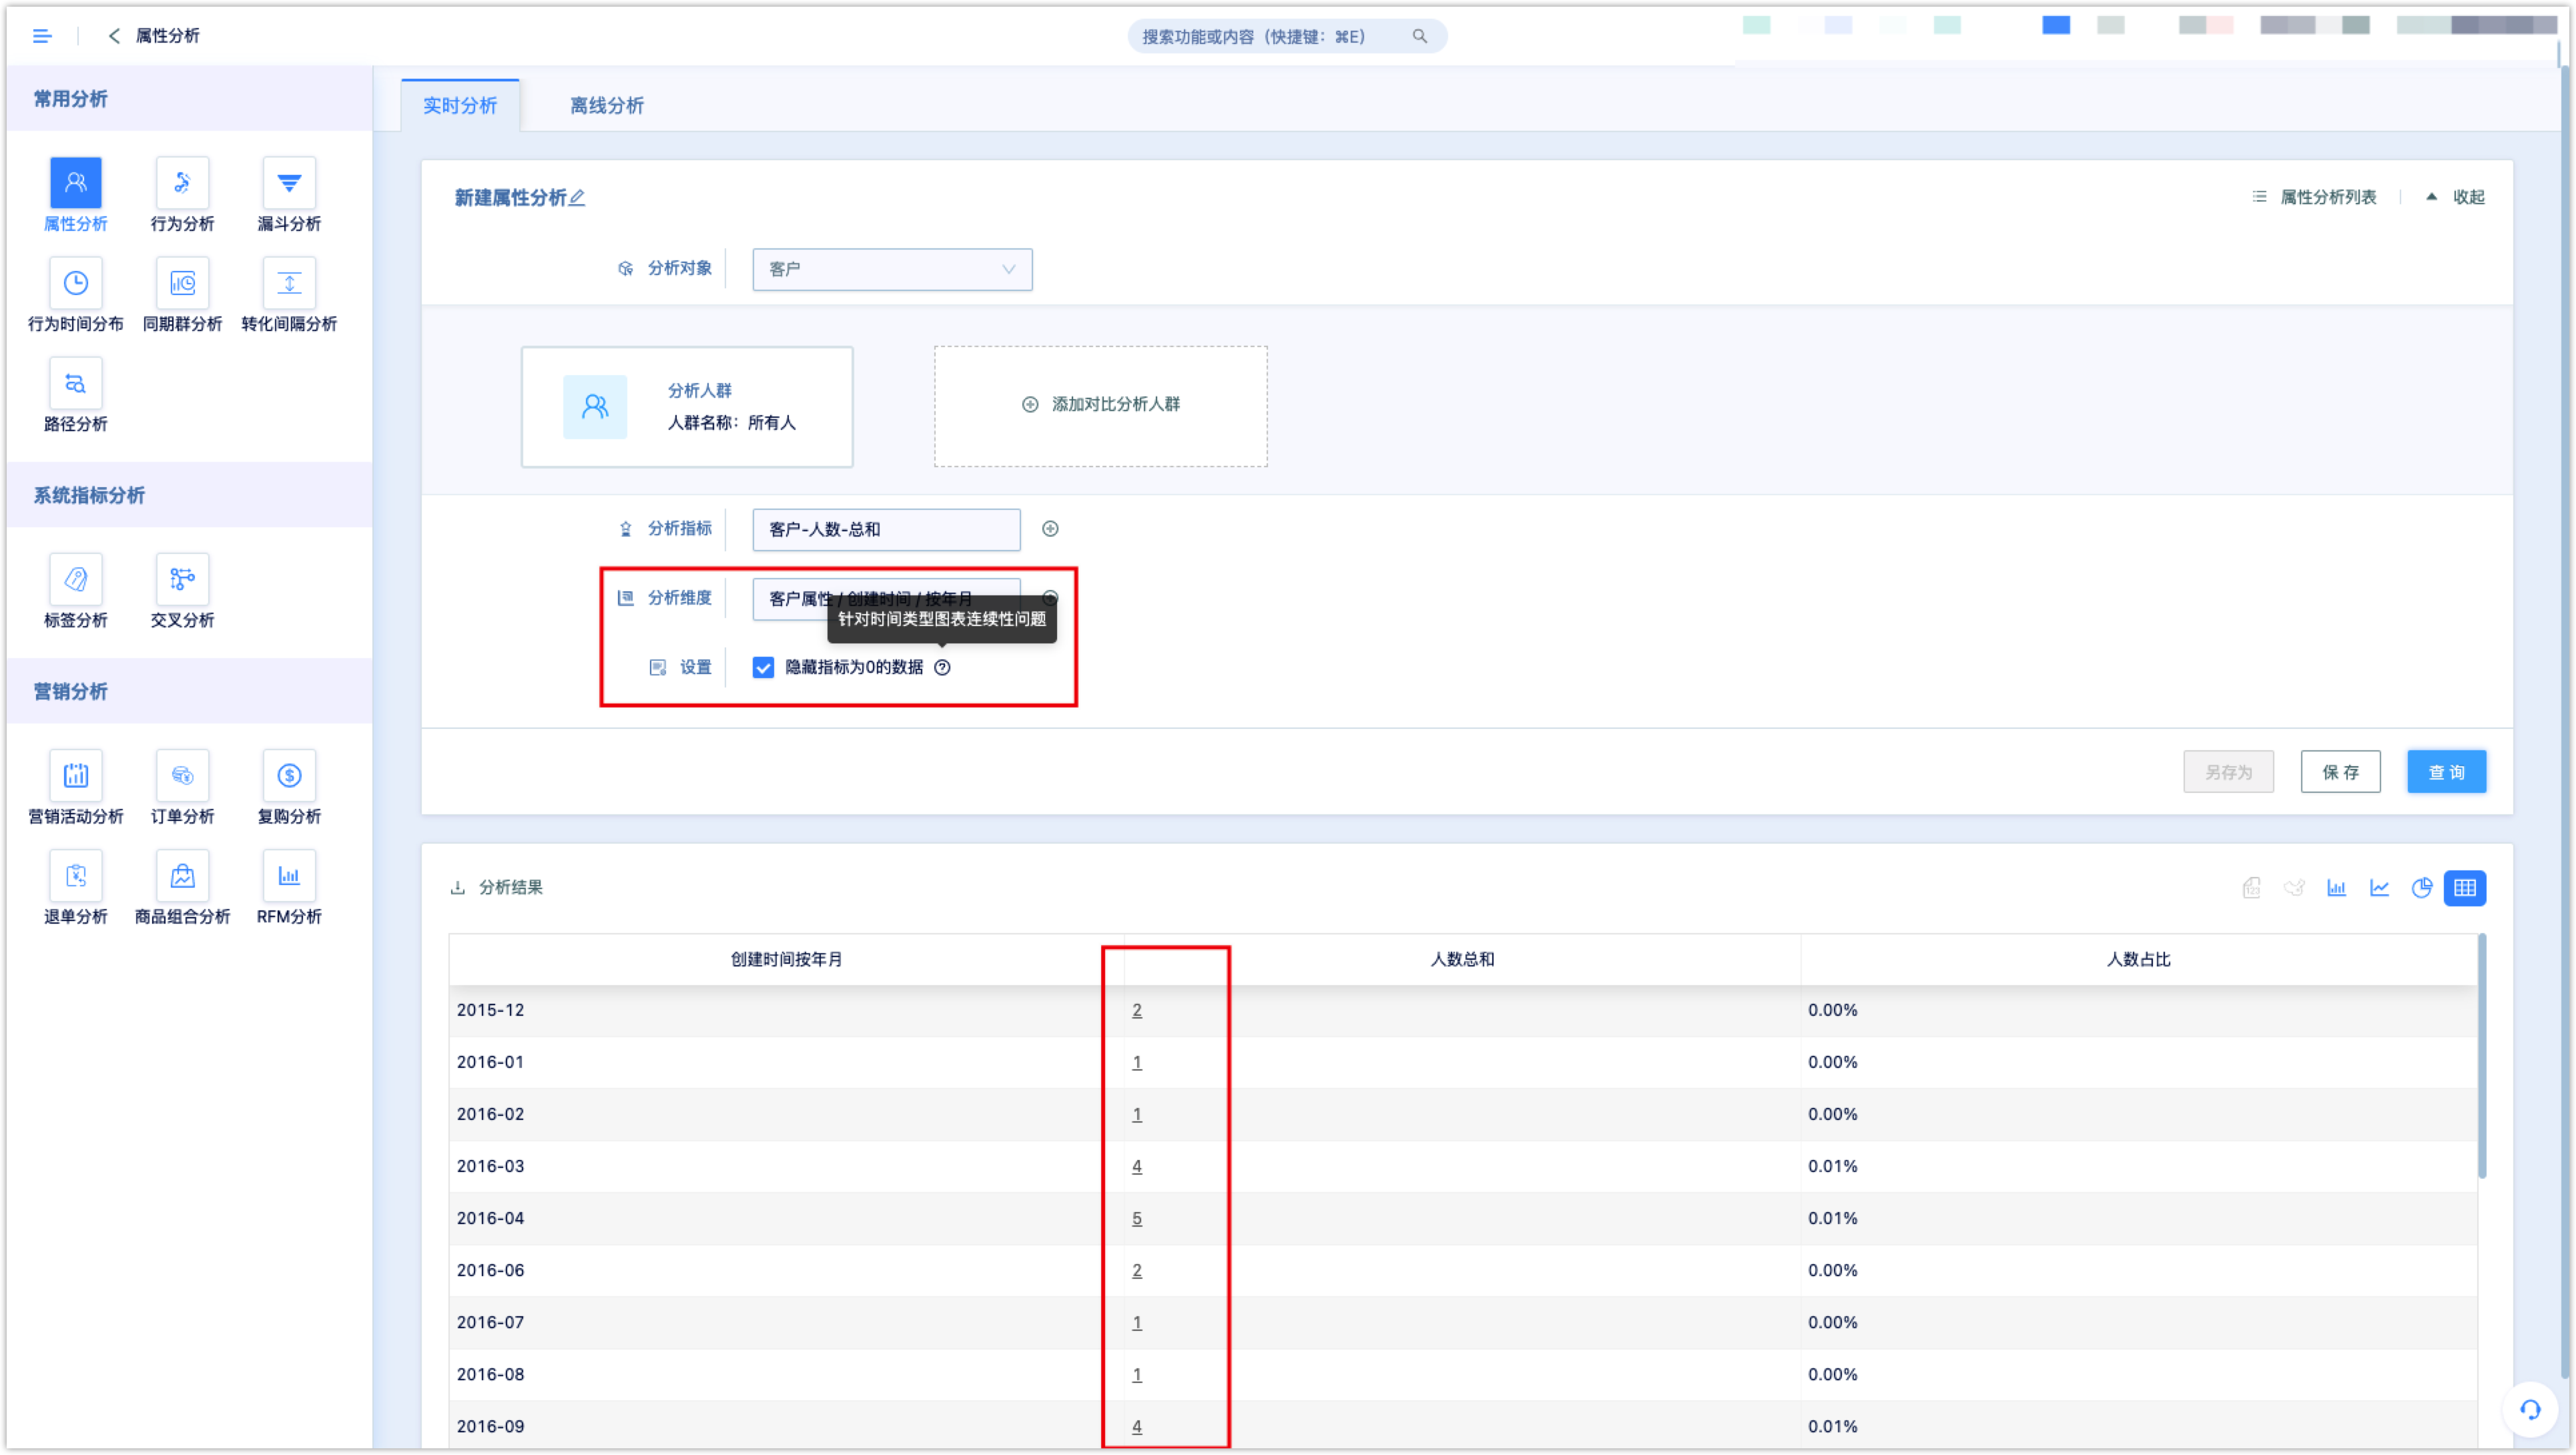
3.4Setting
When the analysis dimension is a time-type dimension, the index that turned out to be 0 can be hidden, which is more convenient for continuous display of time chart.
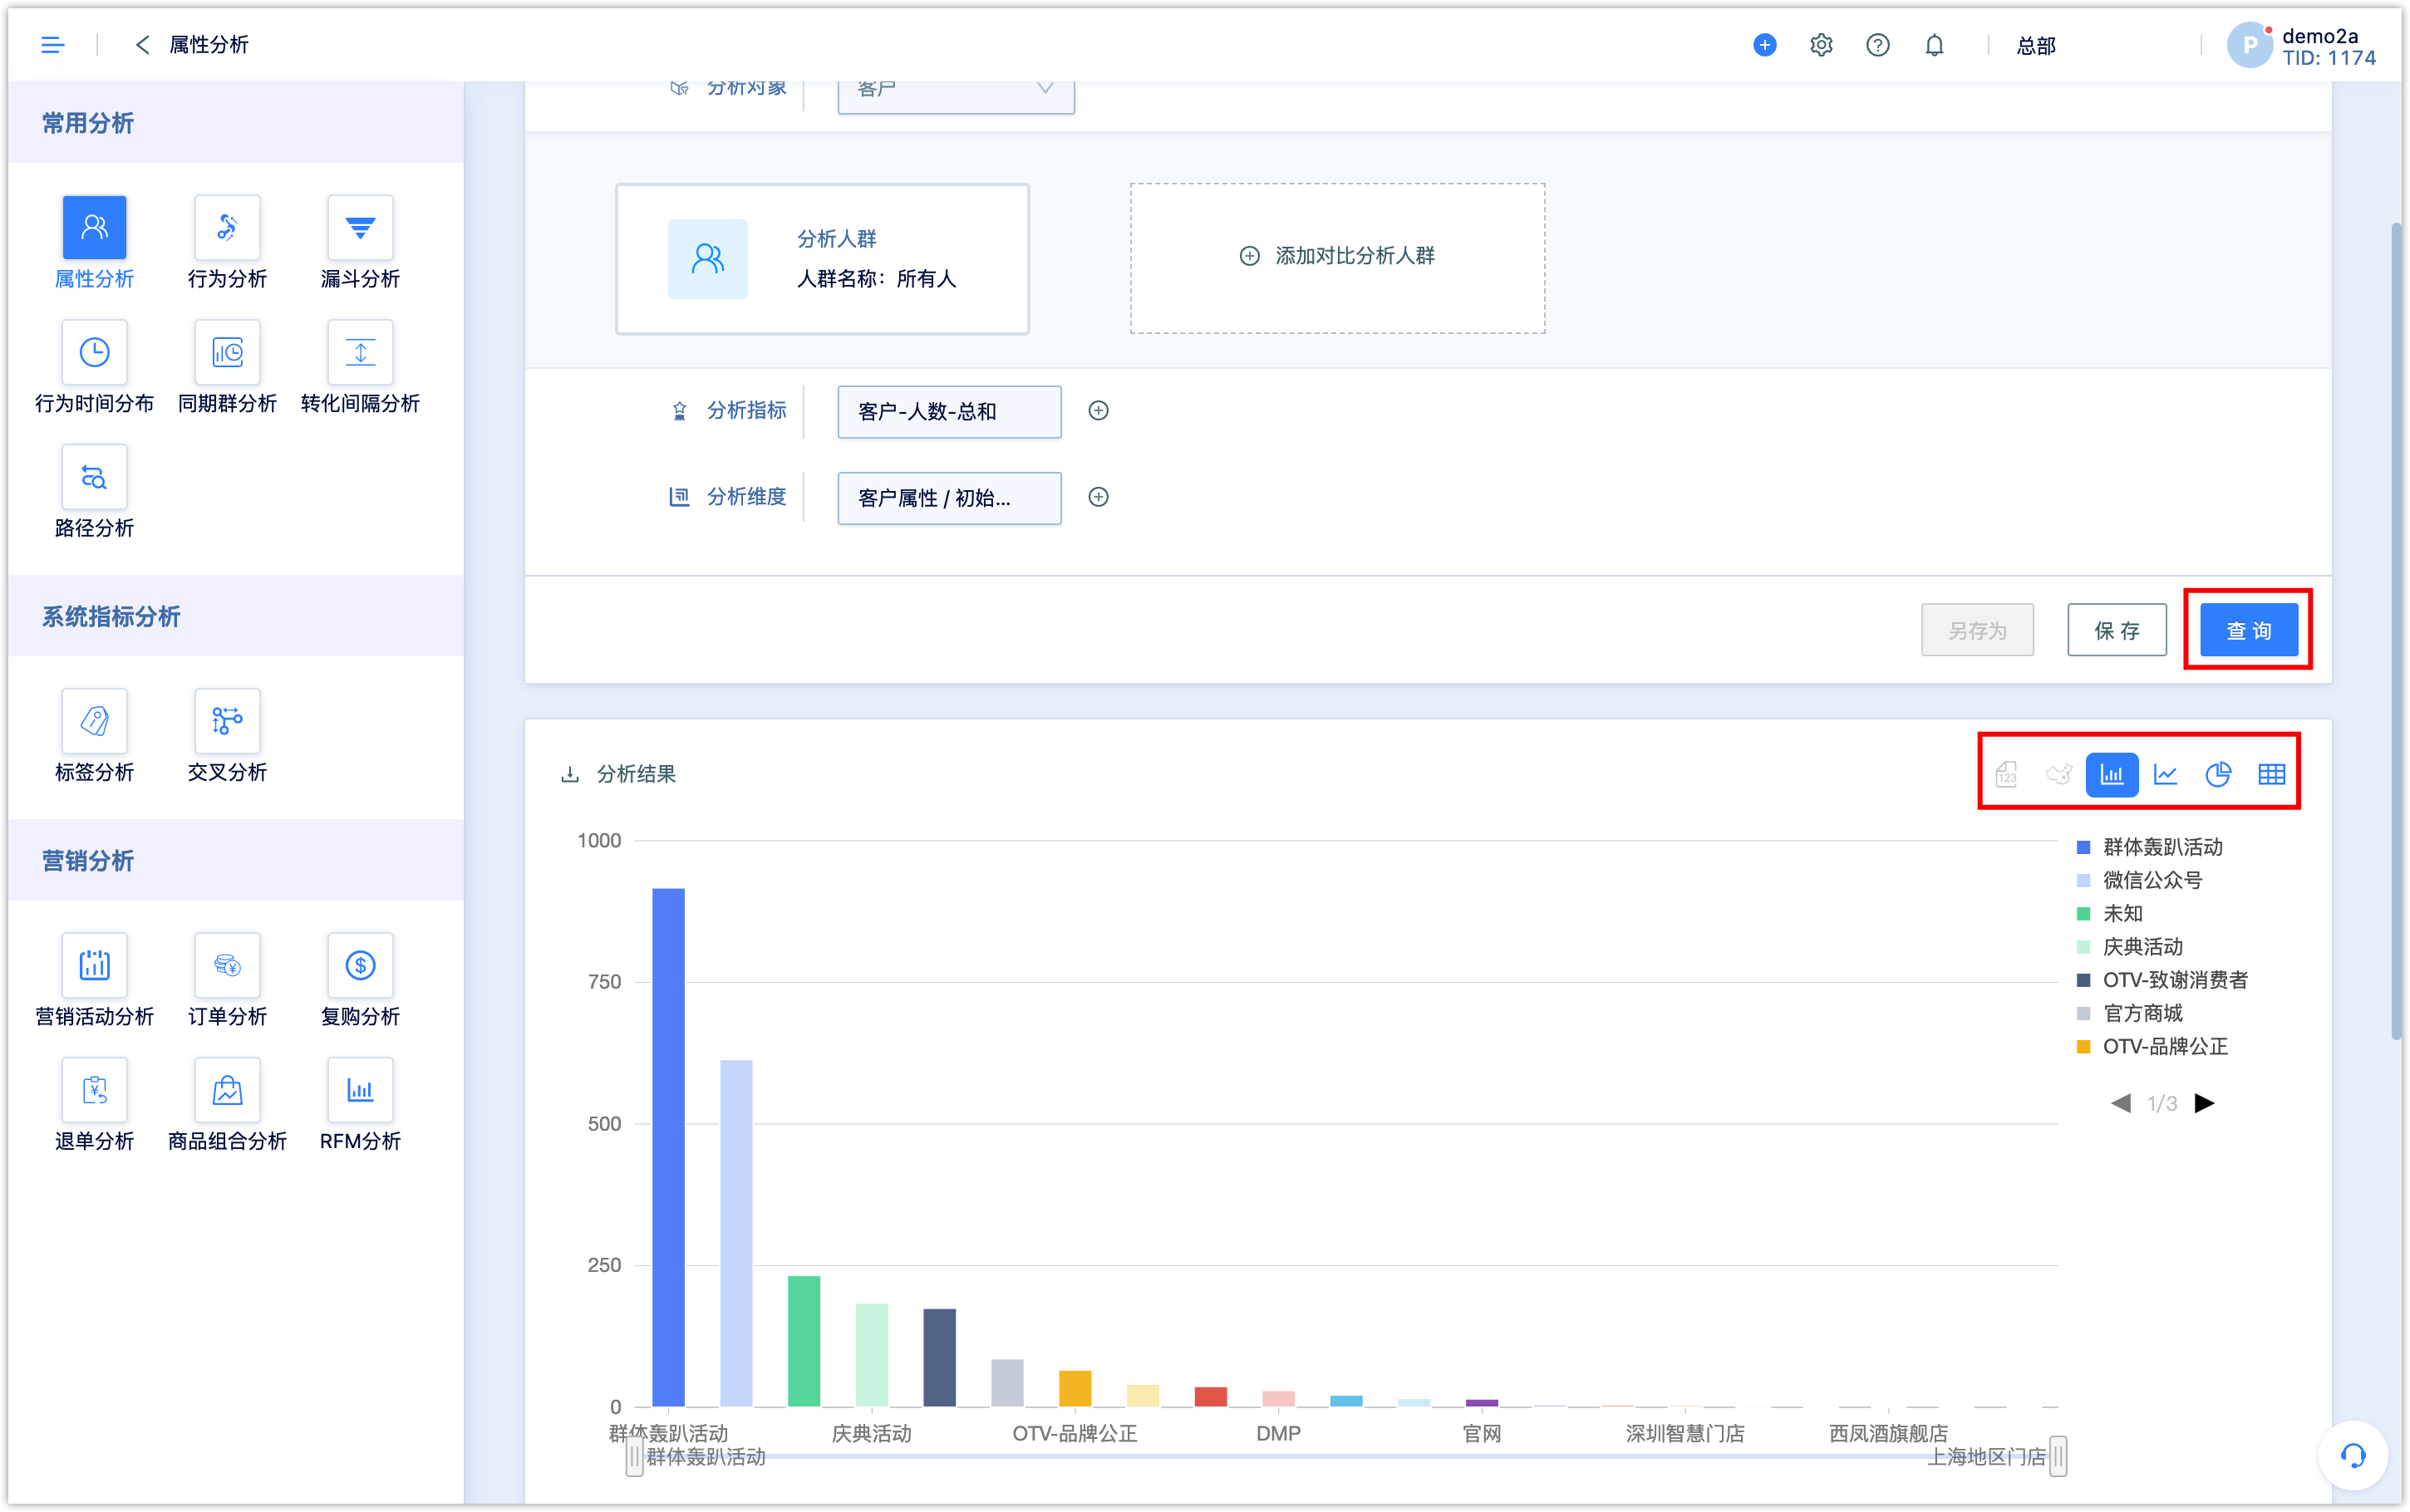
3.5View analysis outcome
After setting, click [Query] to view the analysis results. You can switch to the chart.