Behavioral time distribution
1.Features overview
You can select any event in the system, view the event within a limited time according to the 24-hour distribution heat map of the week, and understand the time heat distribution of different events of the customer.
2.Process guide
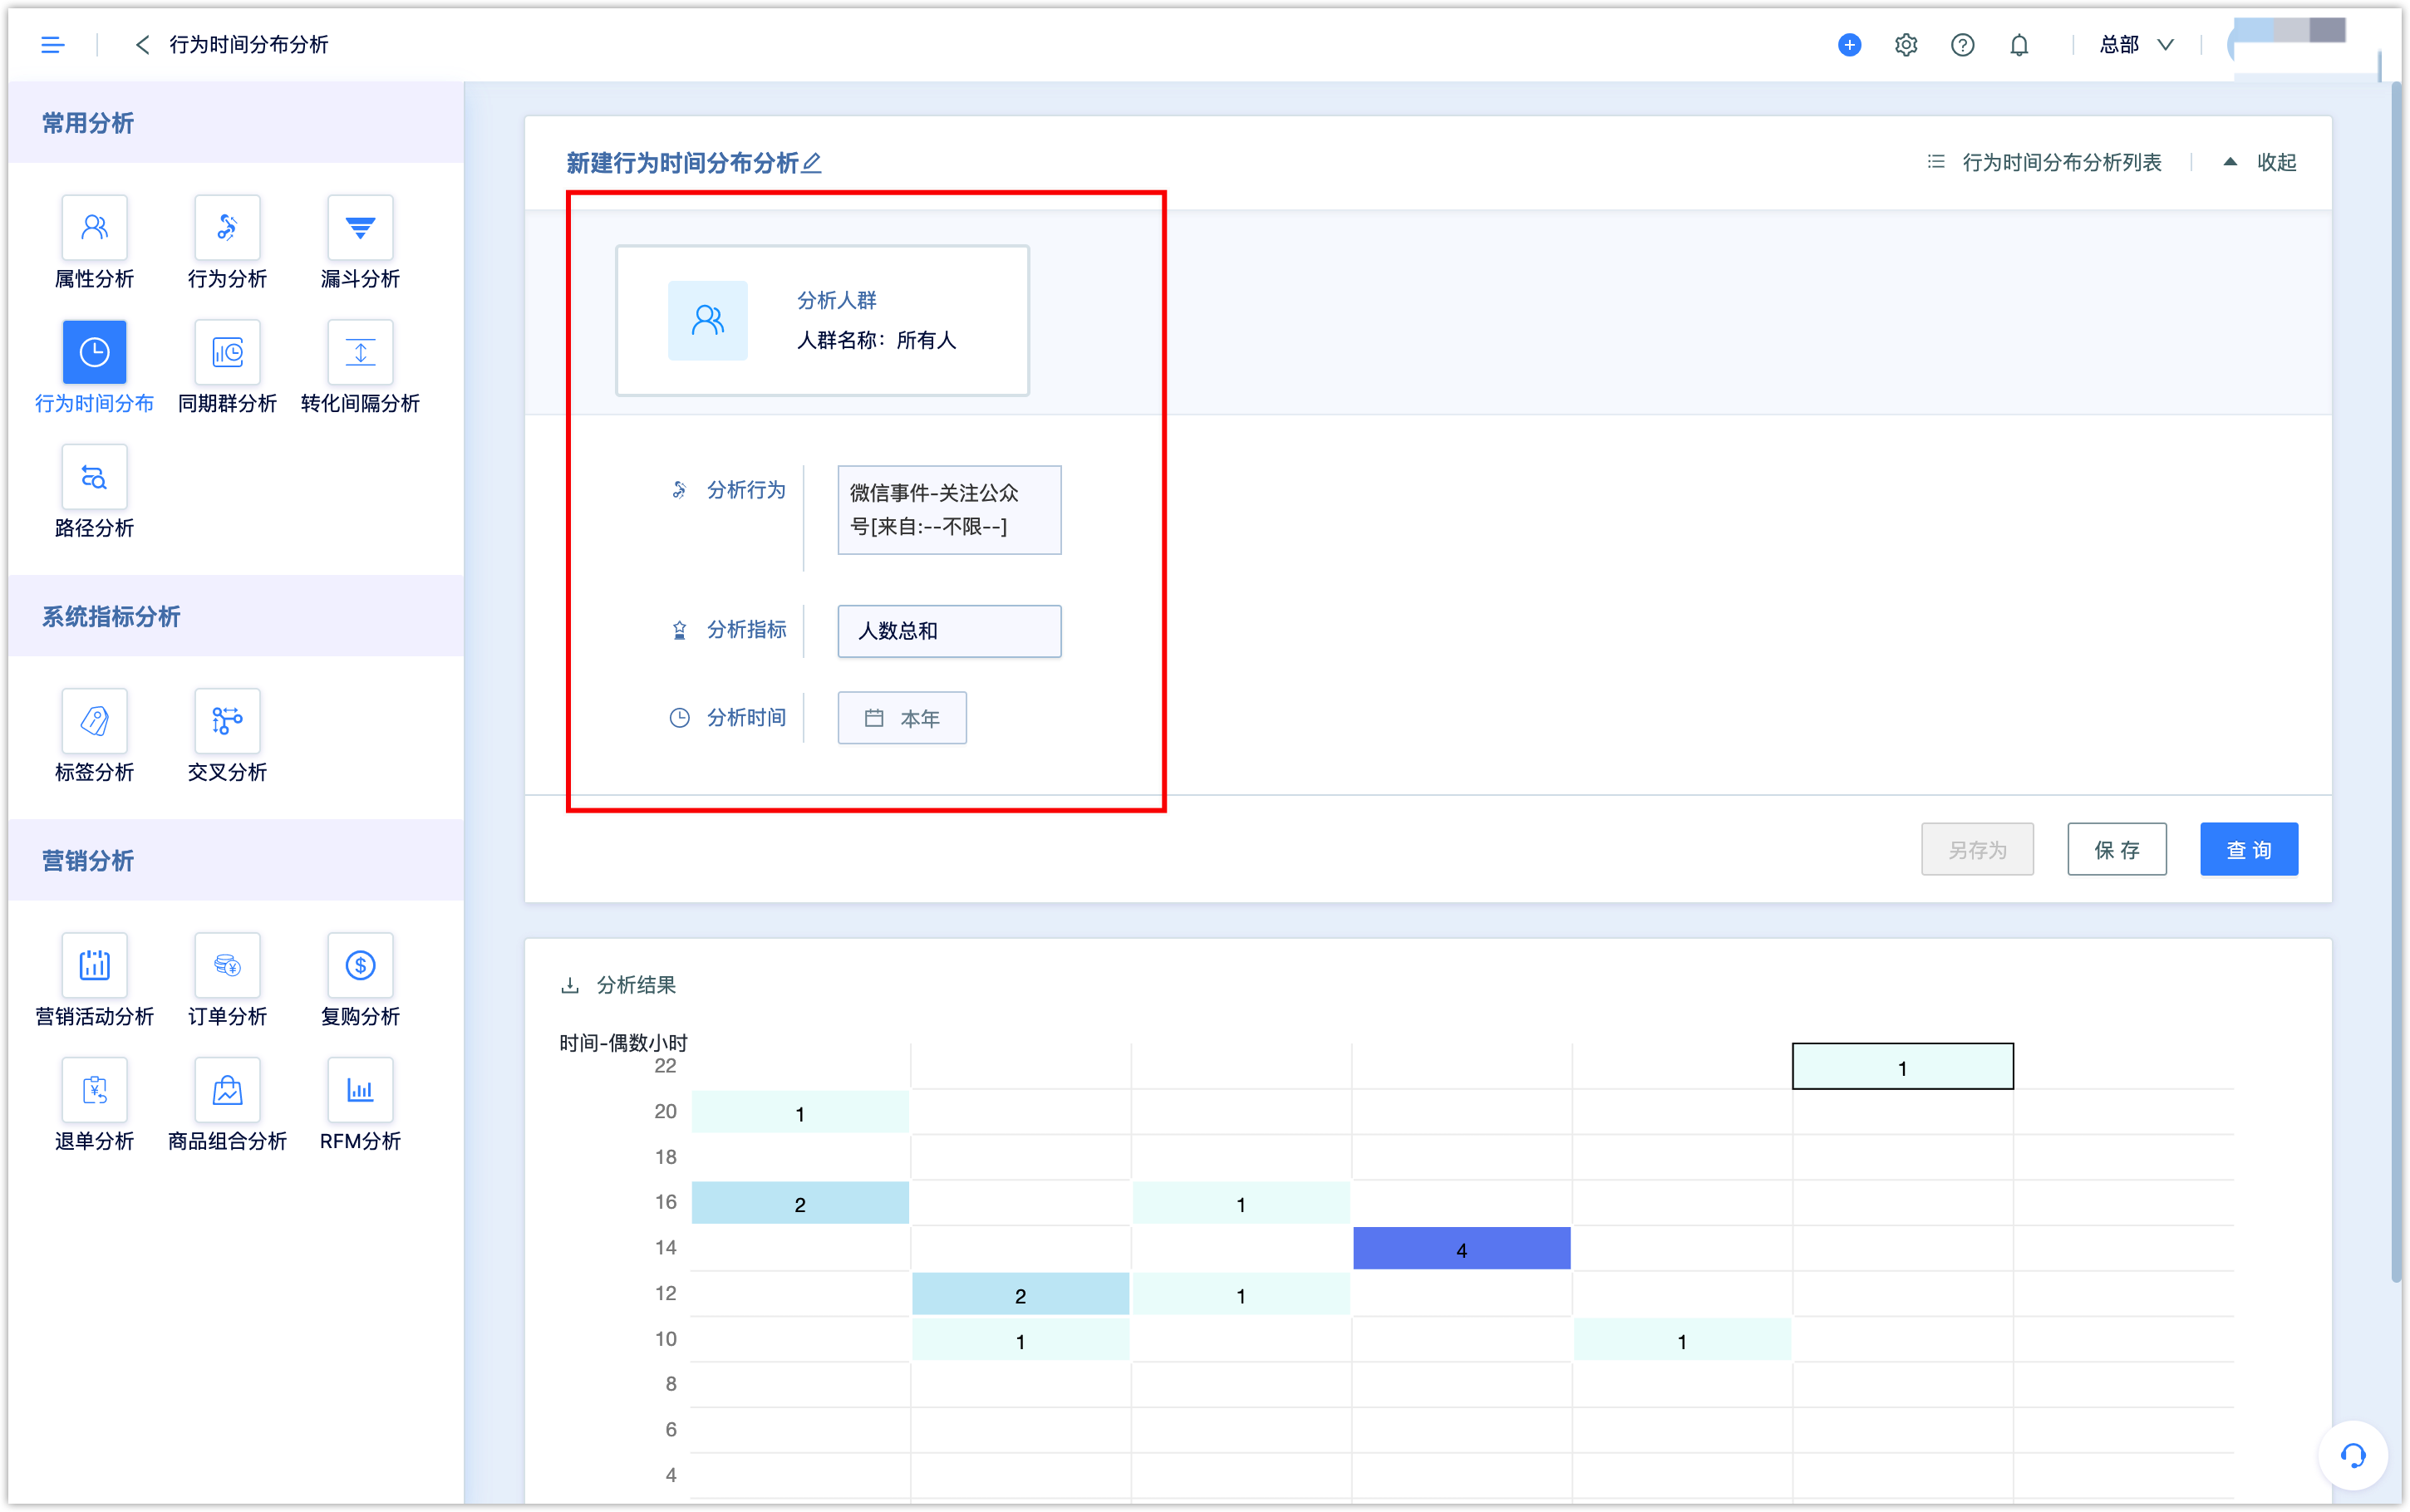
- Analysis group: you can select different groups or filter out the analysis people.
- Analysis behavior: Select the event to be analyzed and event restriction and time restriction is supported.
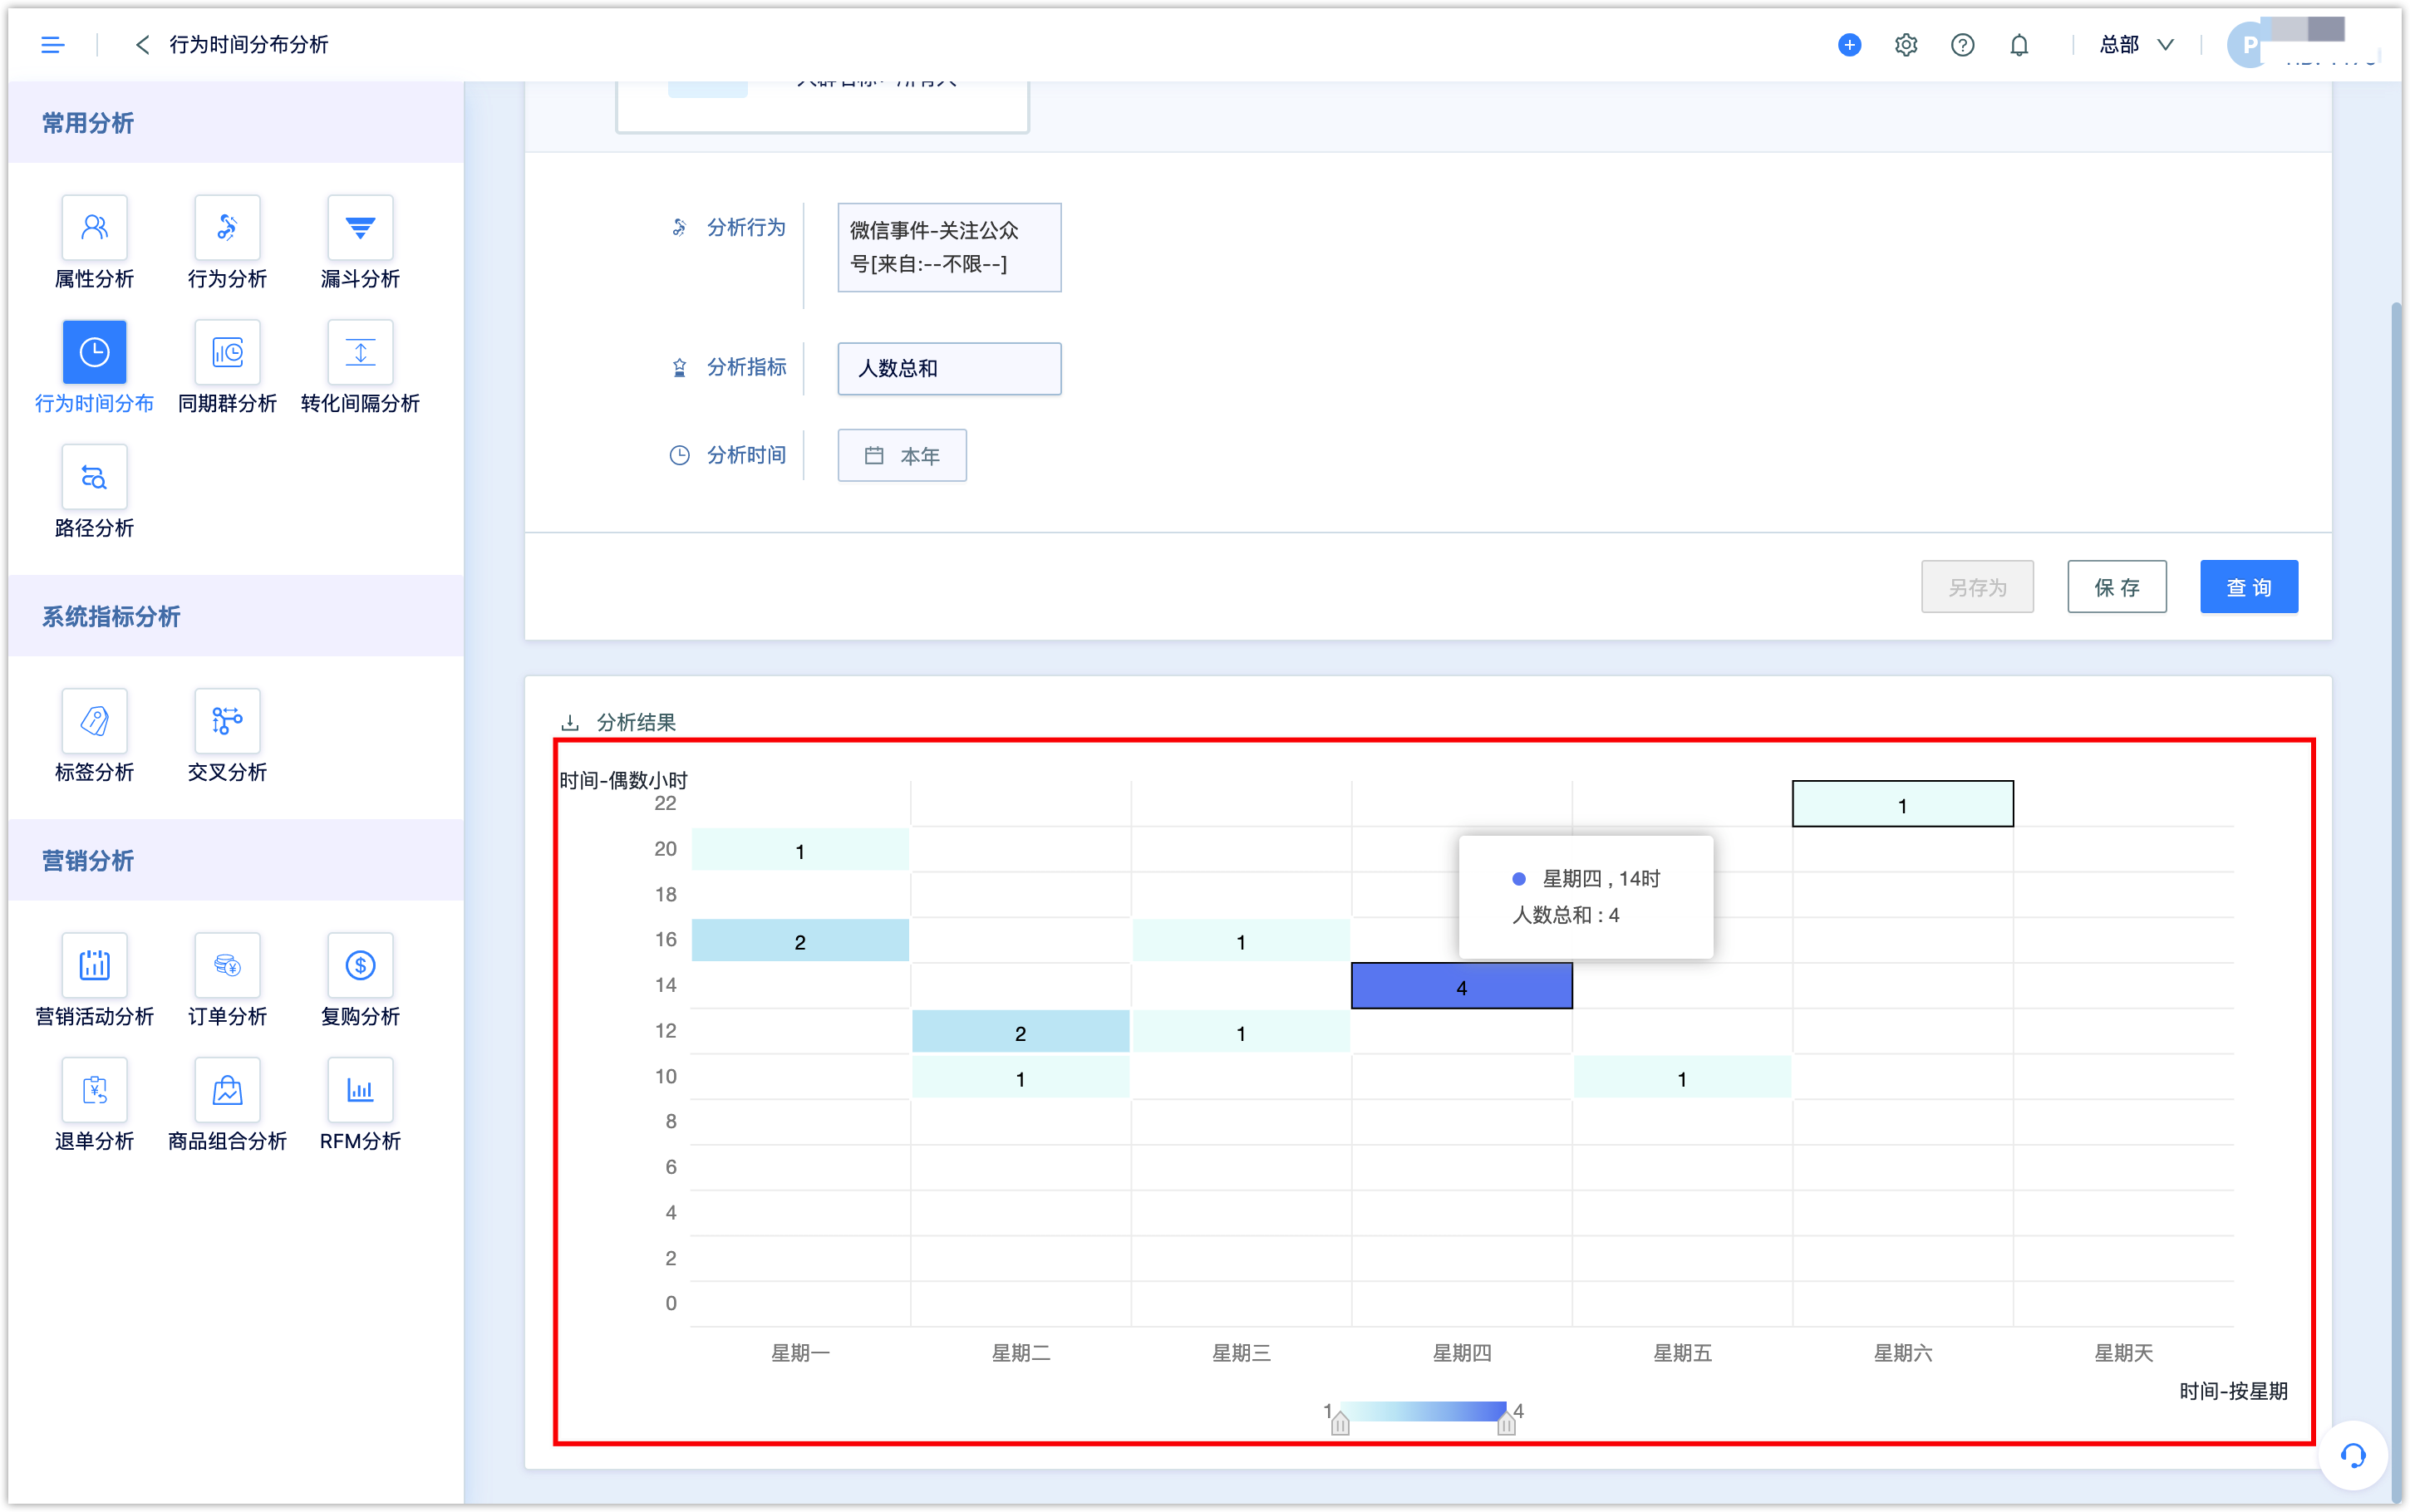
- Analysis indexes: The indexes of the heat map can be displayed according to the number of people and the number of times.
- Analysis time: Select the time interval when the event occurs, you can choose absolute time and relative time, such as last year, past 30 days, etc.
Click [Query] to get the analysis results. You can view the distribution of events for 24 hours by week. The darker the color, the greater the number of events that occurred during this time period.