RFM Analysis
1.Overview
The RFM model can dynamically show the customer profile and help the business to more accurately evaluate the value of customers through the three latitudes of customer consumption.
- R:Recency(last purchase time),that is, the number of days since the last purchase, to examine the silent period of customer purchases.
- F:Frequency(the times of purchases within a certain period of time), this indicator is used to refer to whether they are loyal customers
- M:Monetary(total order amount), the total amount of the customer's order M is equal to the sum of all orders of this customer, to evaluate the customer's consumption capacity. Whereas m(average order amount) is equal to the total order amount of the customer/The number of the customer’s orders, to examine the customer’s purchasing power .
2.How to conduct a RFM analysis
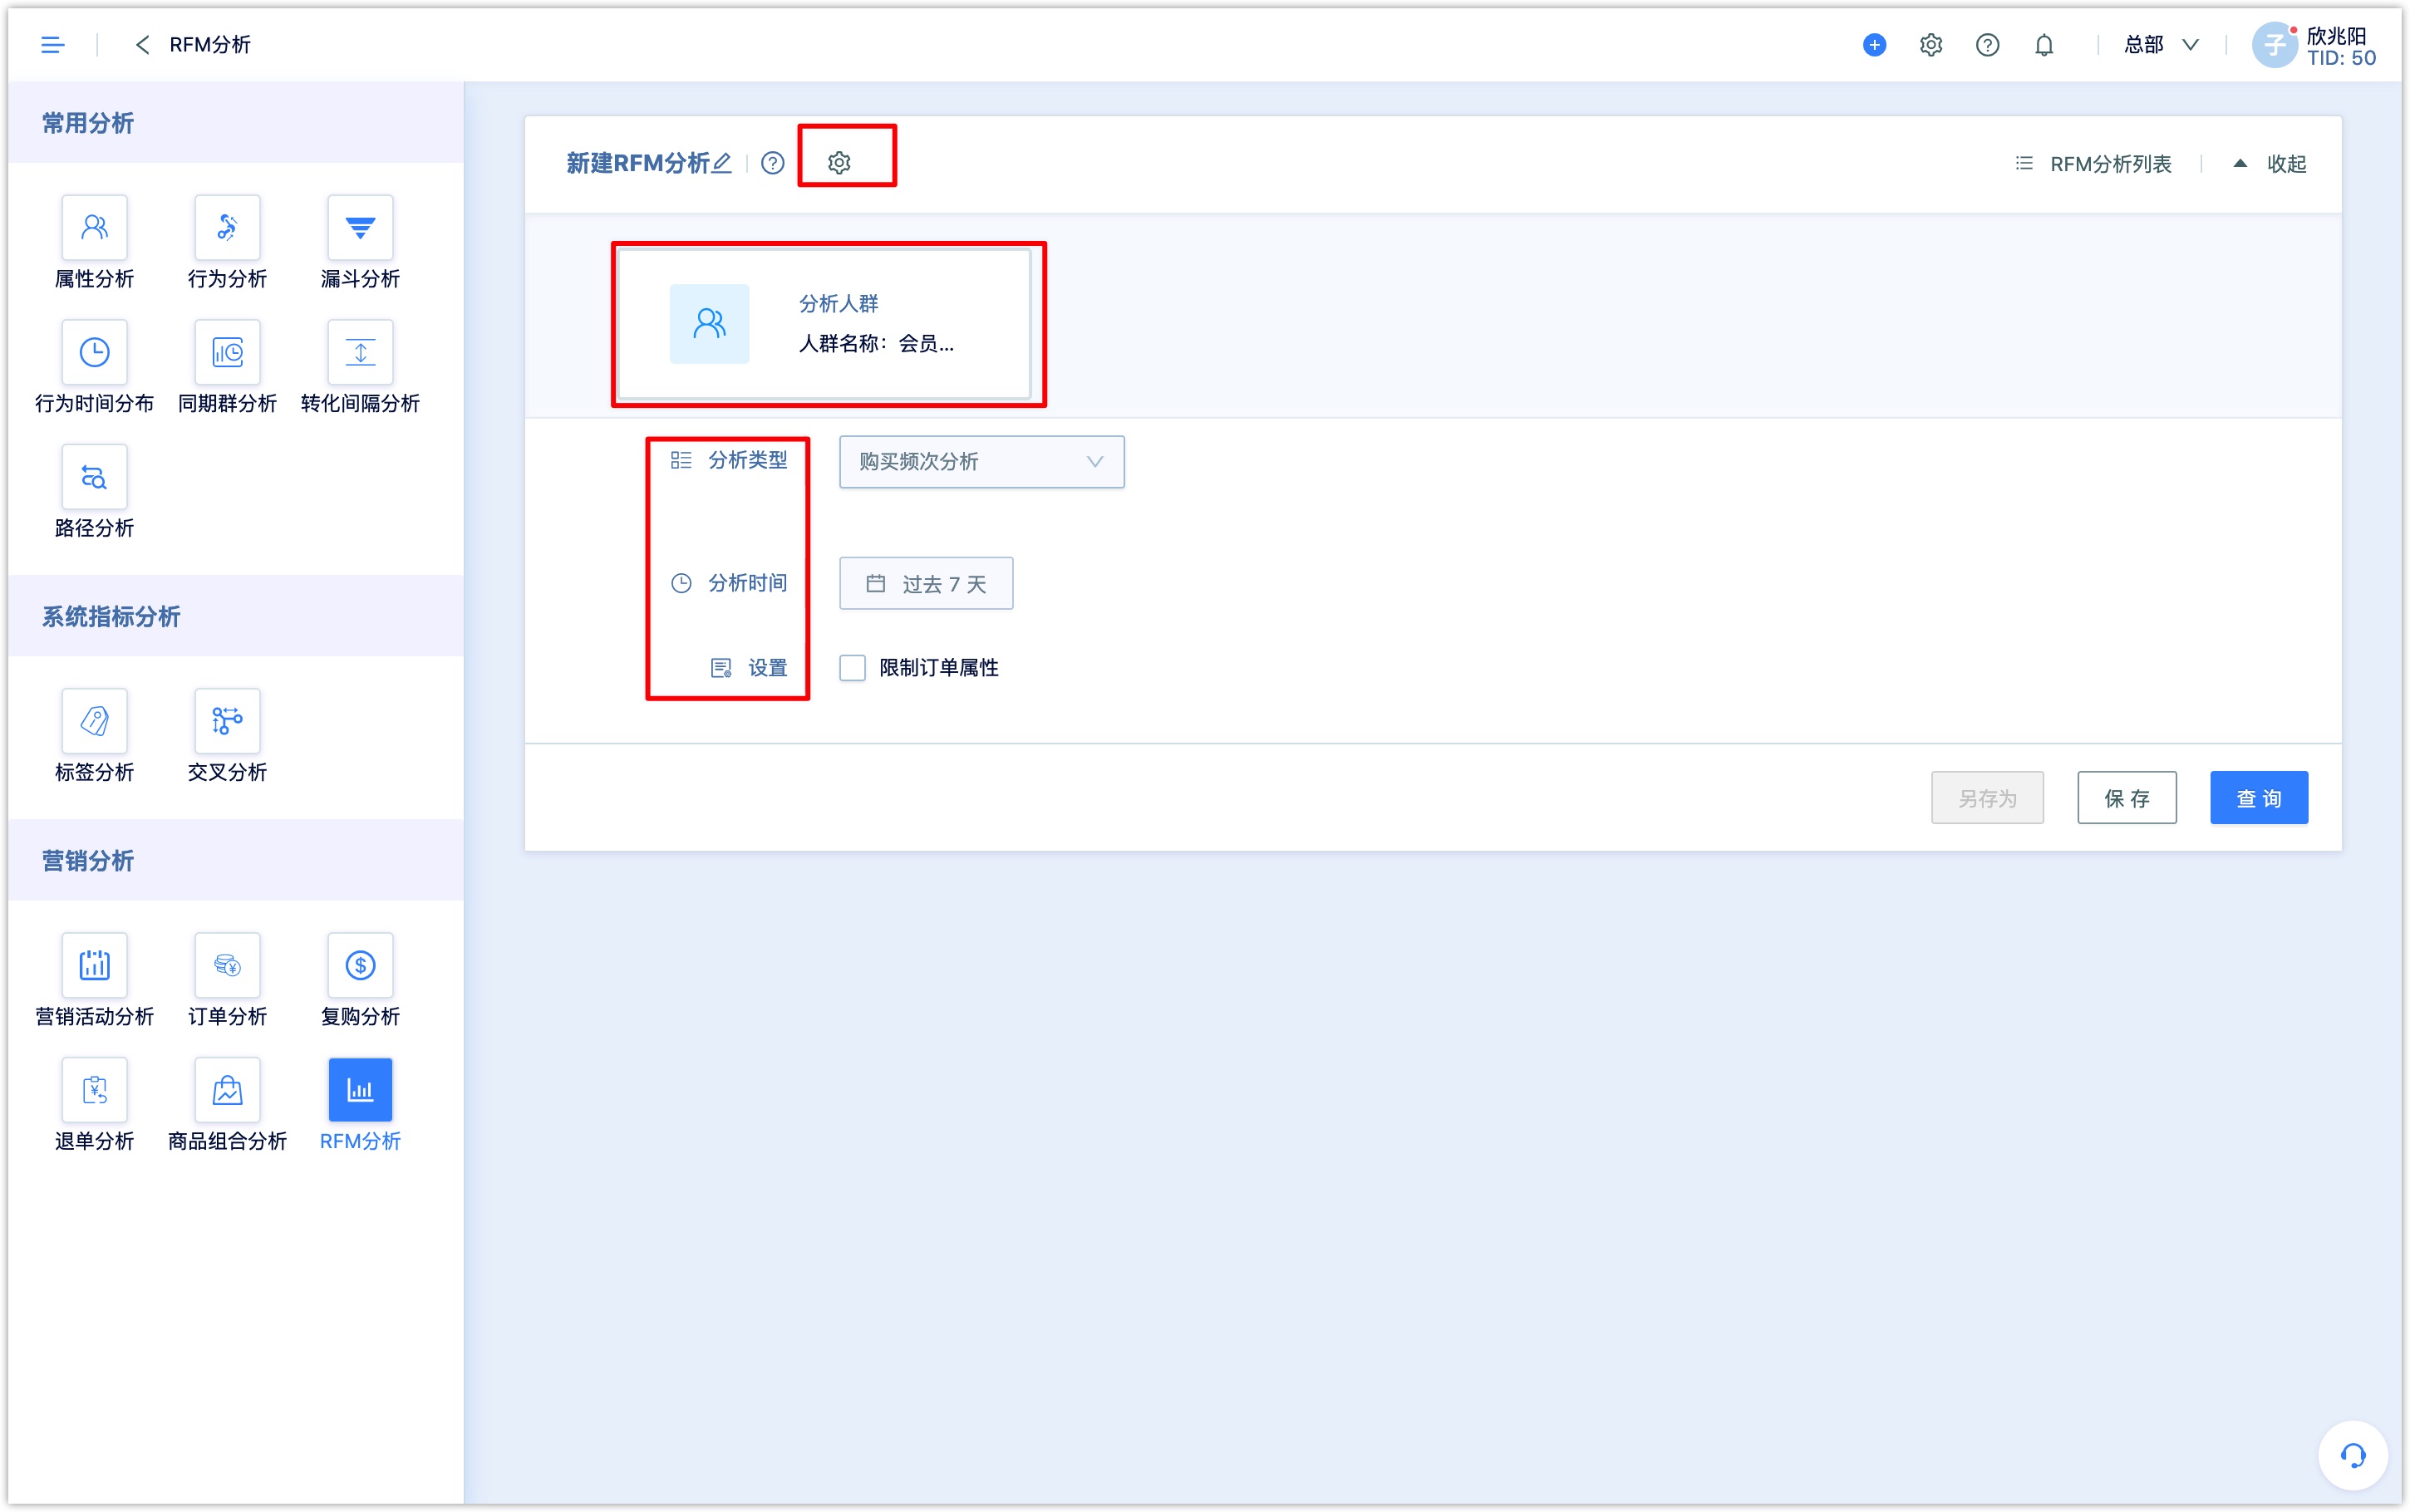
Before doing an analysis, the parameters and analysis time range should be set up, then select the analysis group and analysis type, and limit the order attributes.
2.1Set parameters
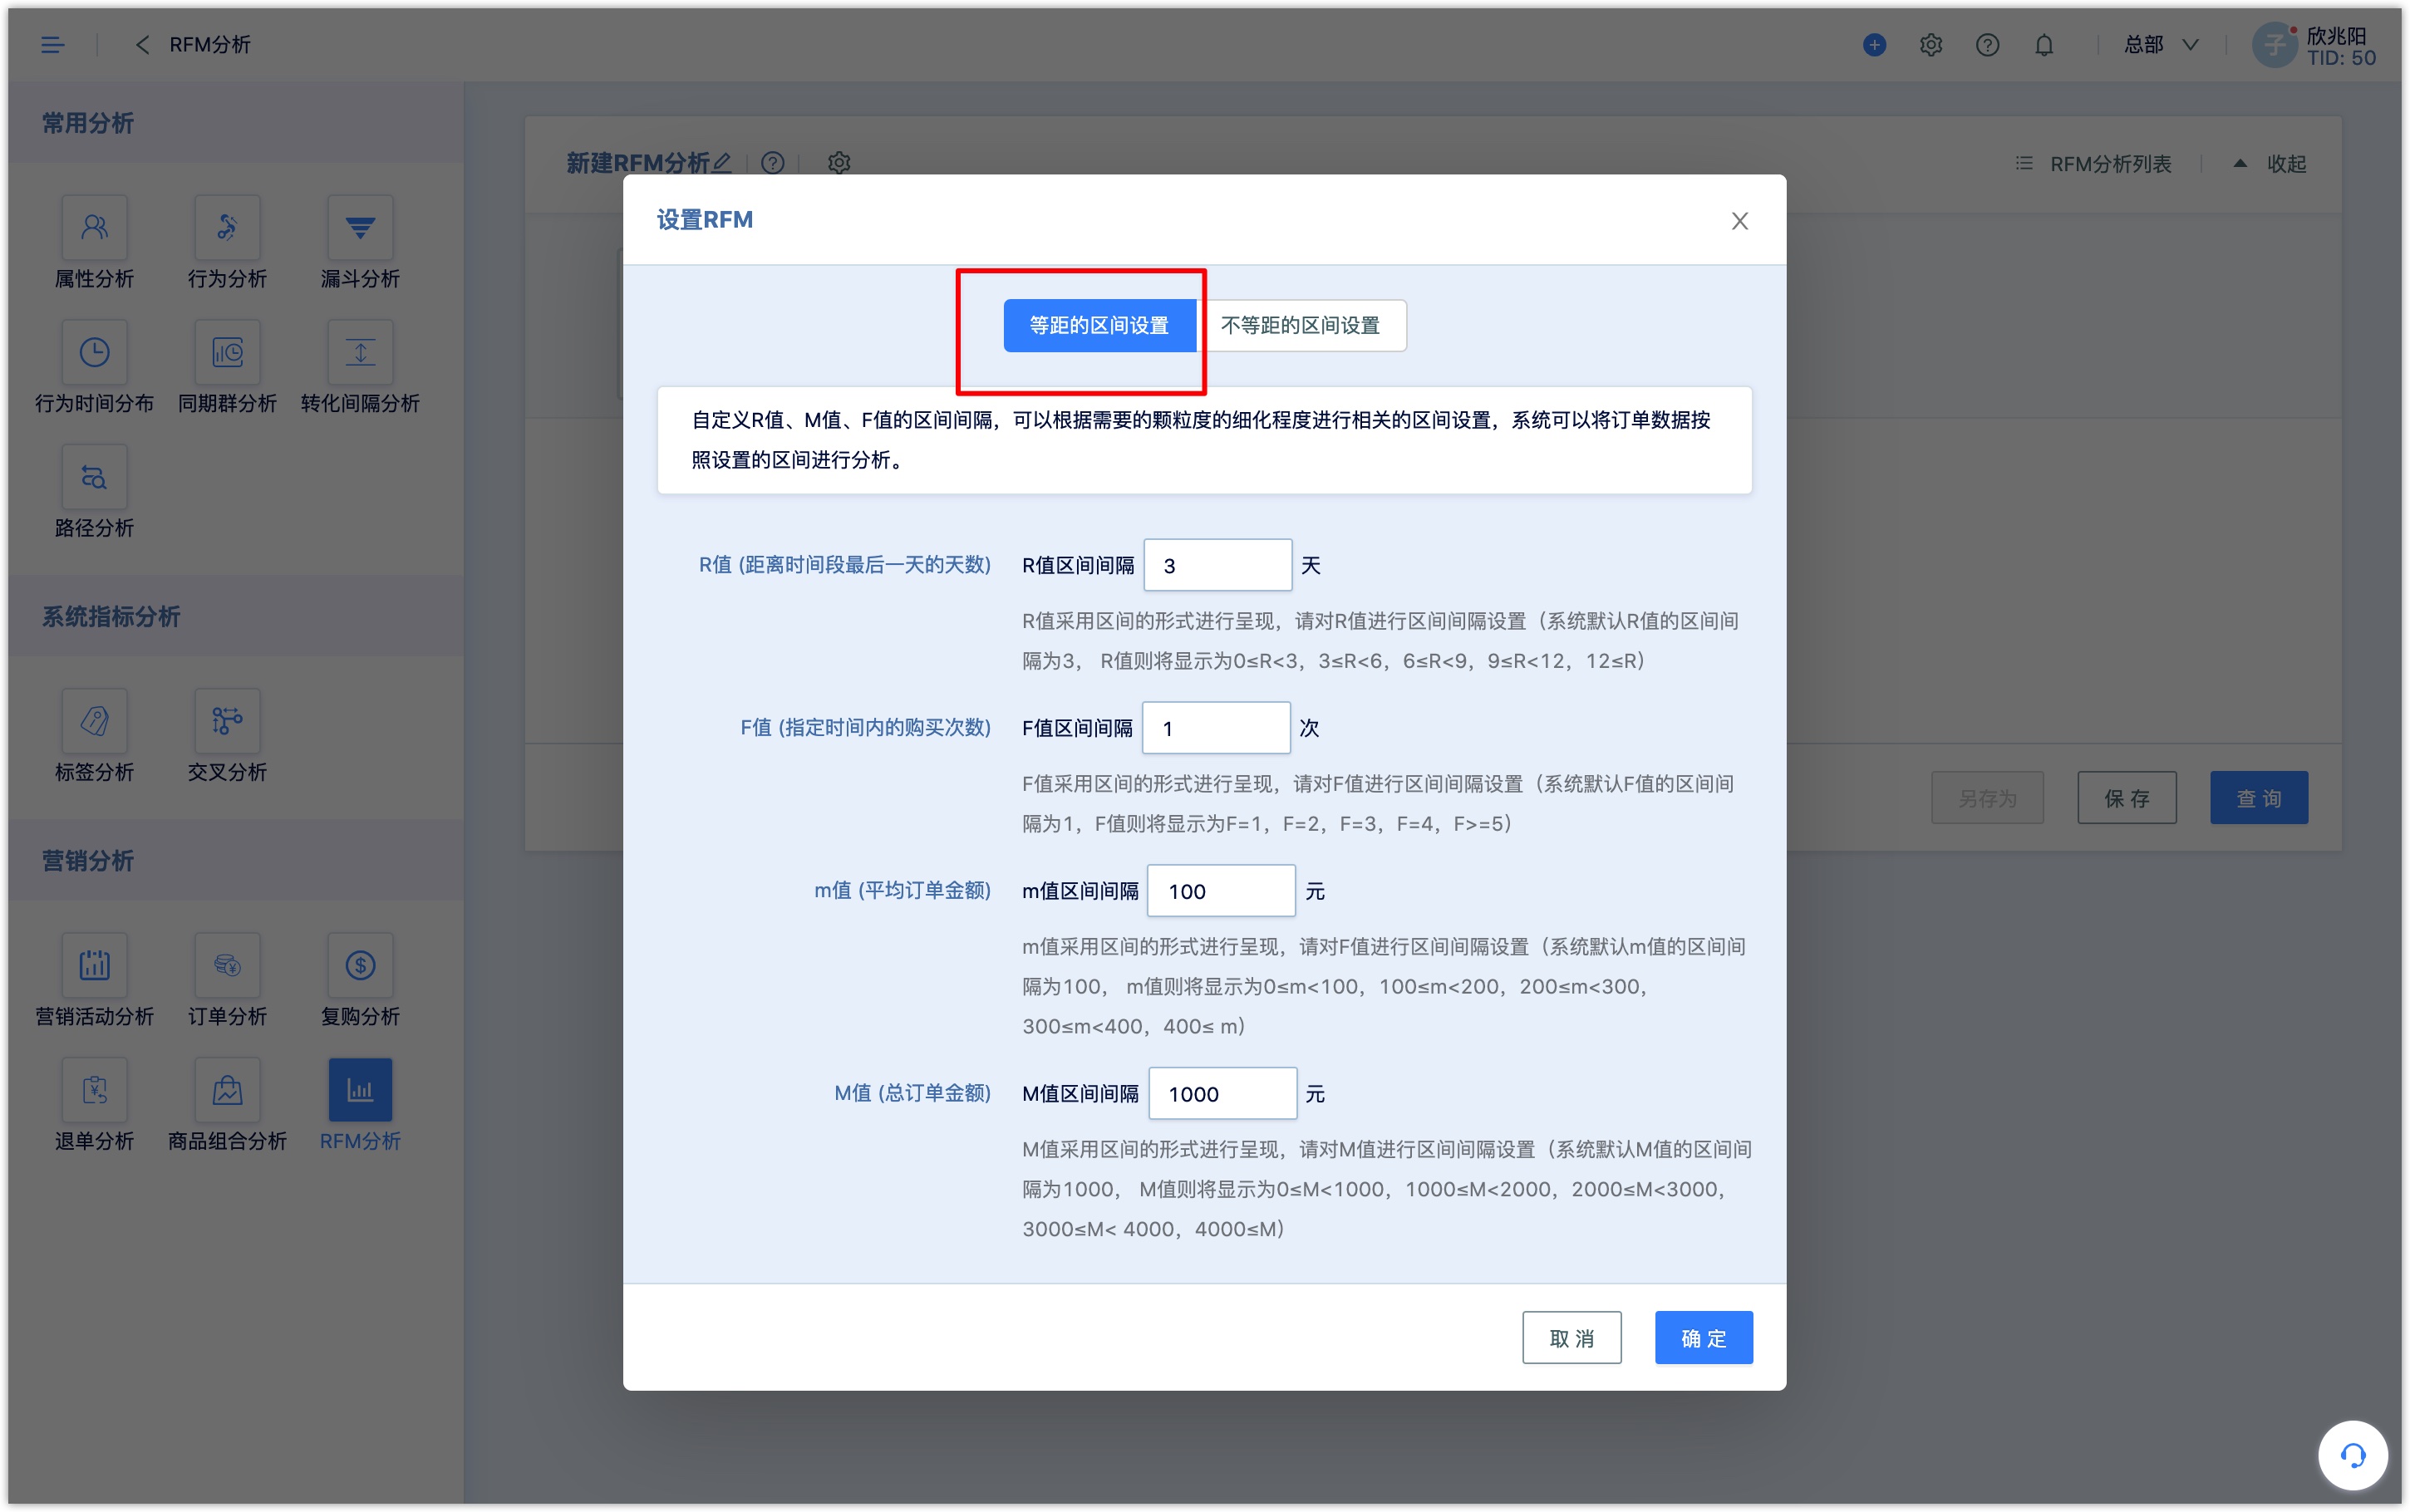
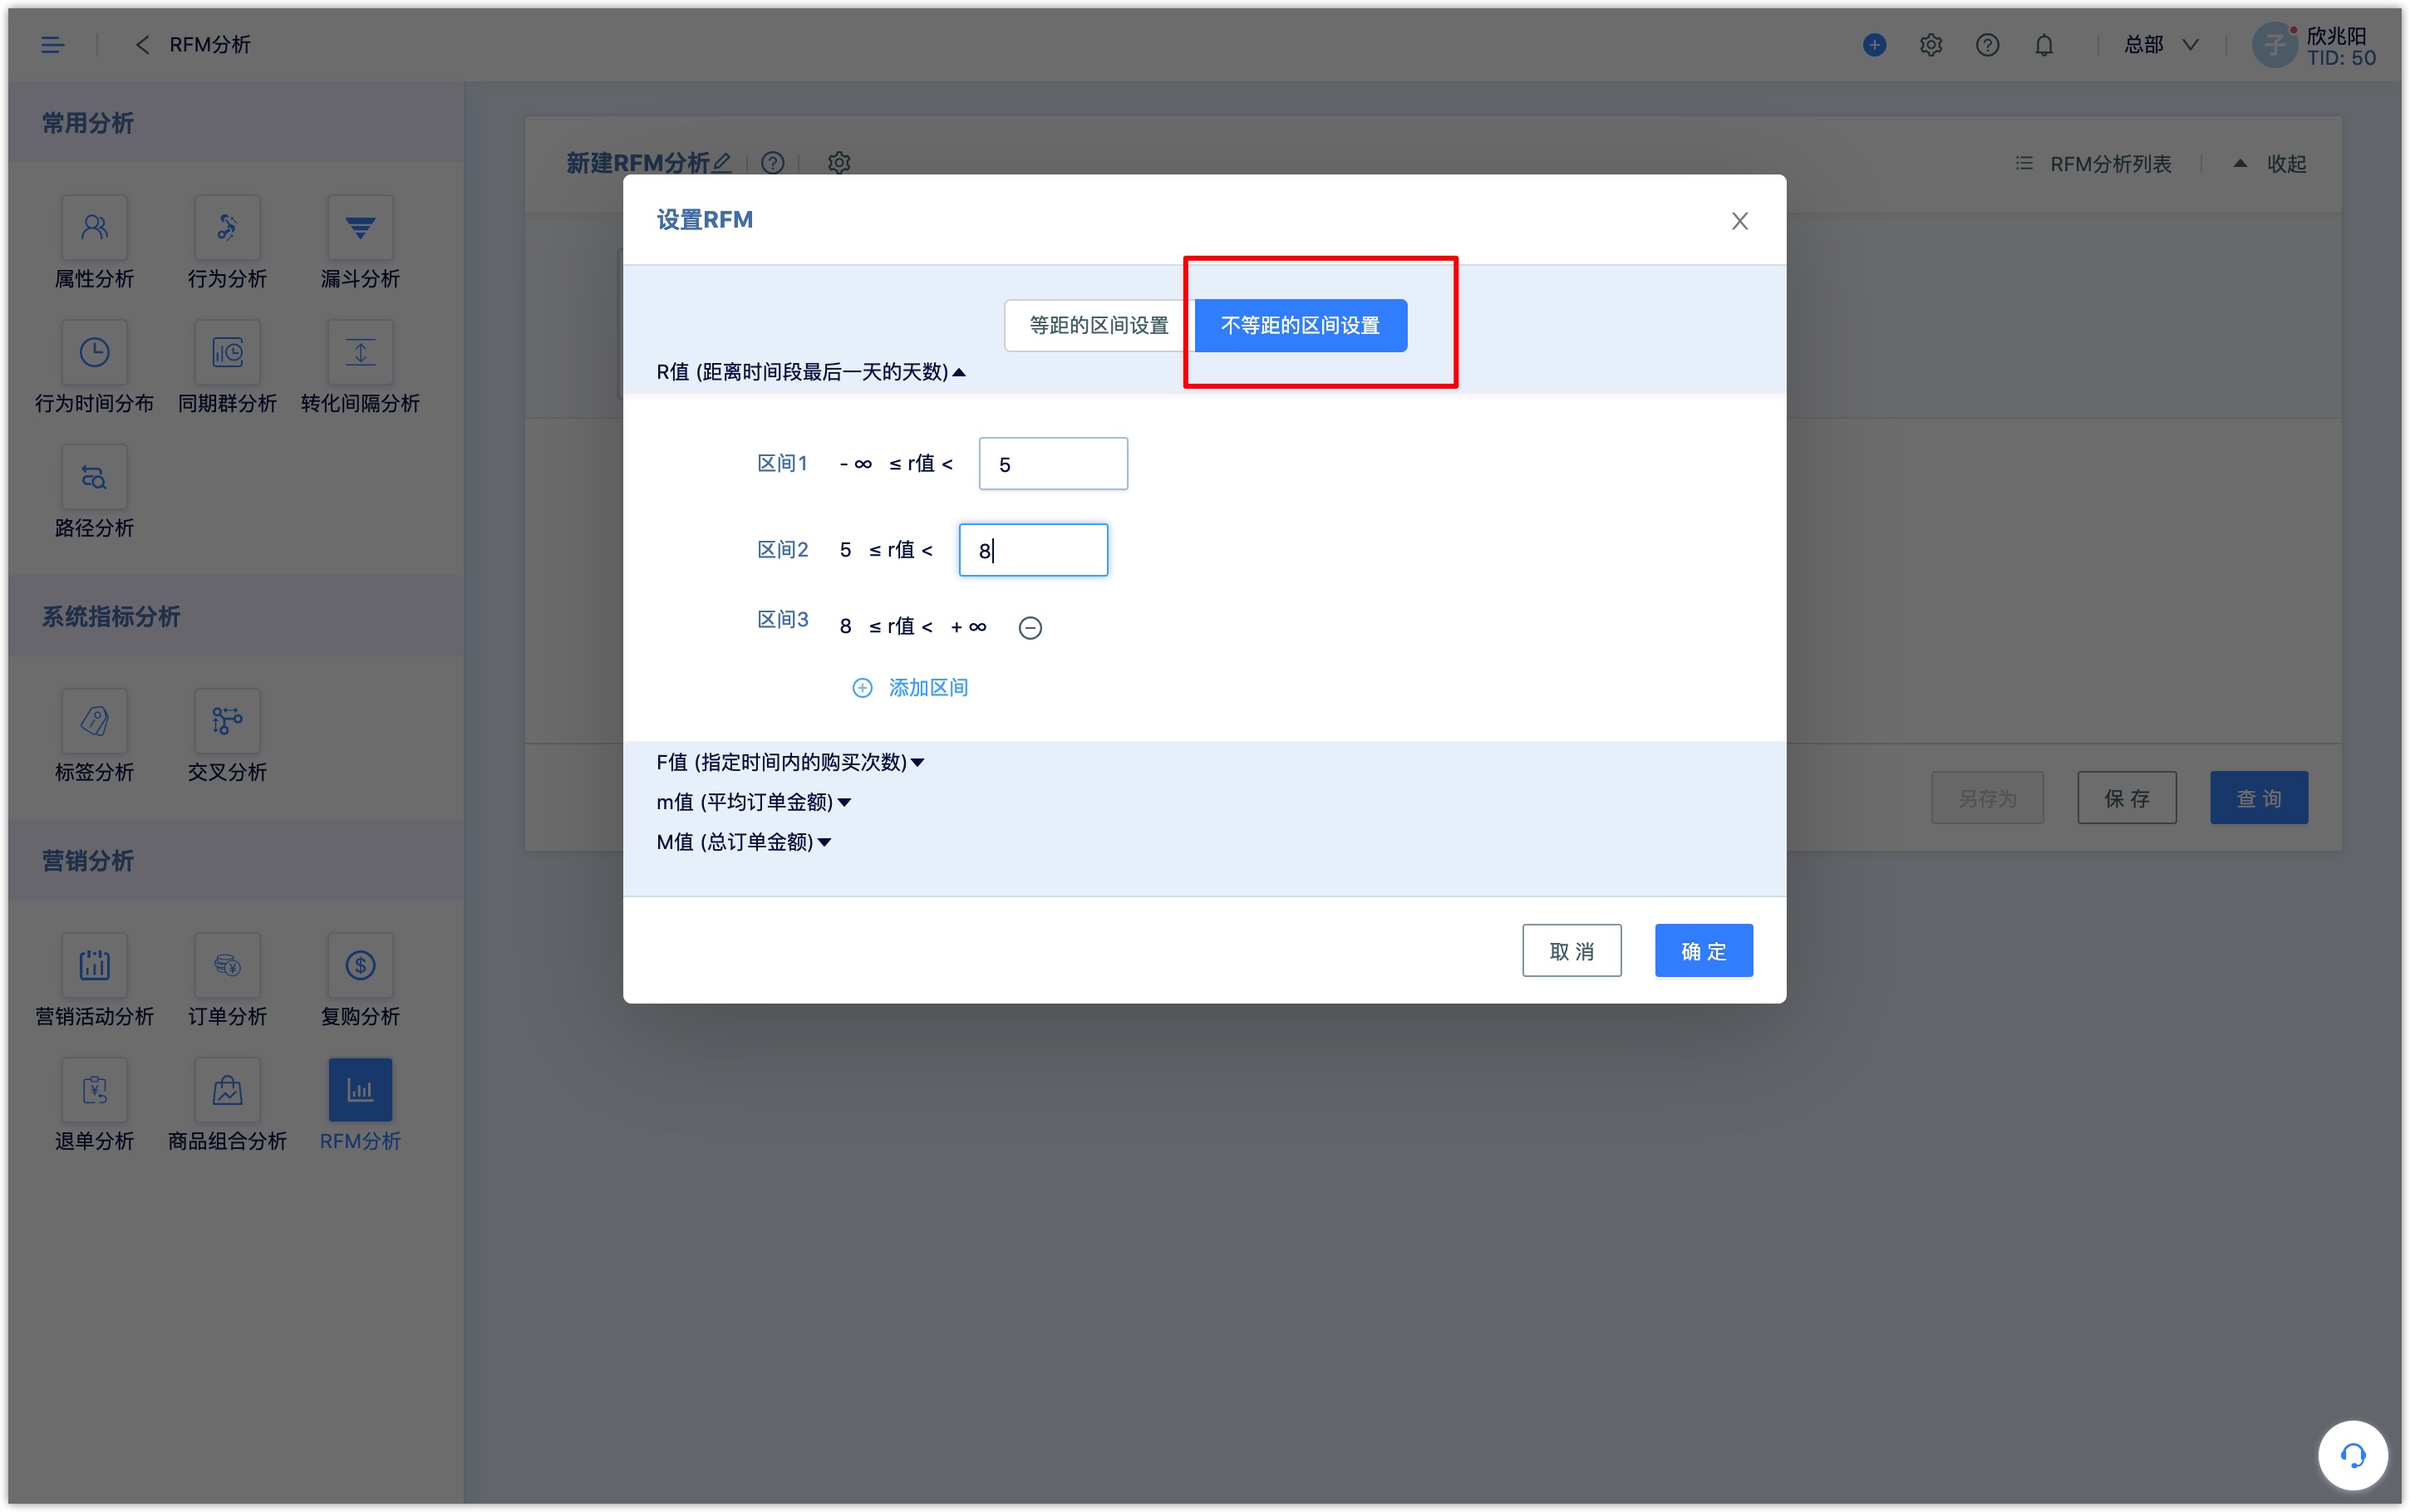
Customize the intervals of R, F and M, and set the relevant interval according to the required degree of analysis needs. DM Hub can analyze the order data according to the set intervals. Both equidistant intervals and unequal intervals are supported to be set.
Note: Enterprises should set indexes and parameters according to your actual business conditions.Equidistant interval: The system presets the interval of R value, F value and M value:
- R value: The interval is 3. For analysis related to R value, the system will display 10 intervals by default : 0≤R<3, 3≤R<6, 6≤R<9,...R≥27
- F value: The interval is 1. For analysis related to F value, the system will display 10 intervals by default: F=1, F=2, F=3...F≥10
- m value: the interval is 100. For analysis related to the value of m, the system will display 10 intervals by default: 0≤m<100, 100≤m<200, 200≤m<300......m≥1000
- M value: the interval is 1000. For analysis related to the M value, the system will display 10 intervals by default: 0≤M<1000, 1000≤M<2000, 2000≤M<3000...M≥10000
Unequal intervals:
Fill in interval range separately
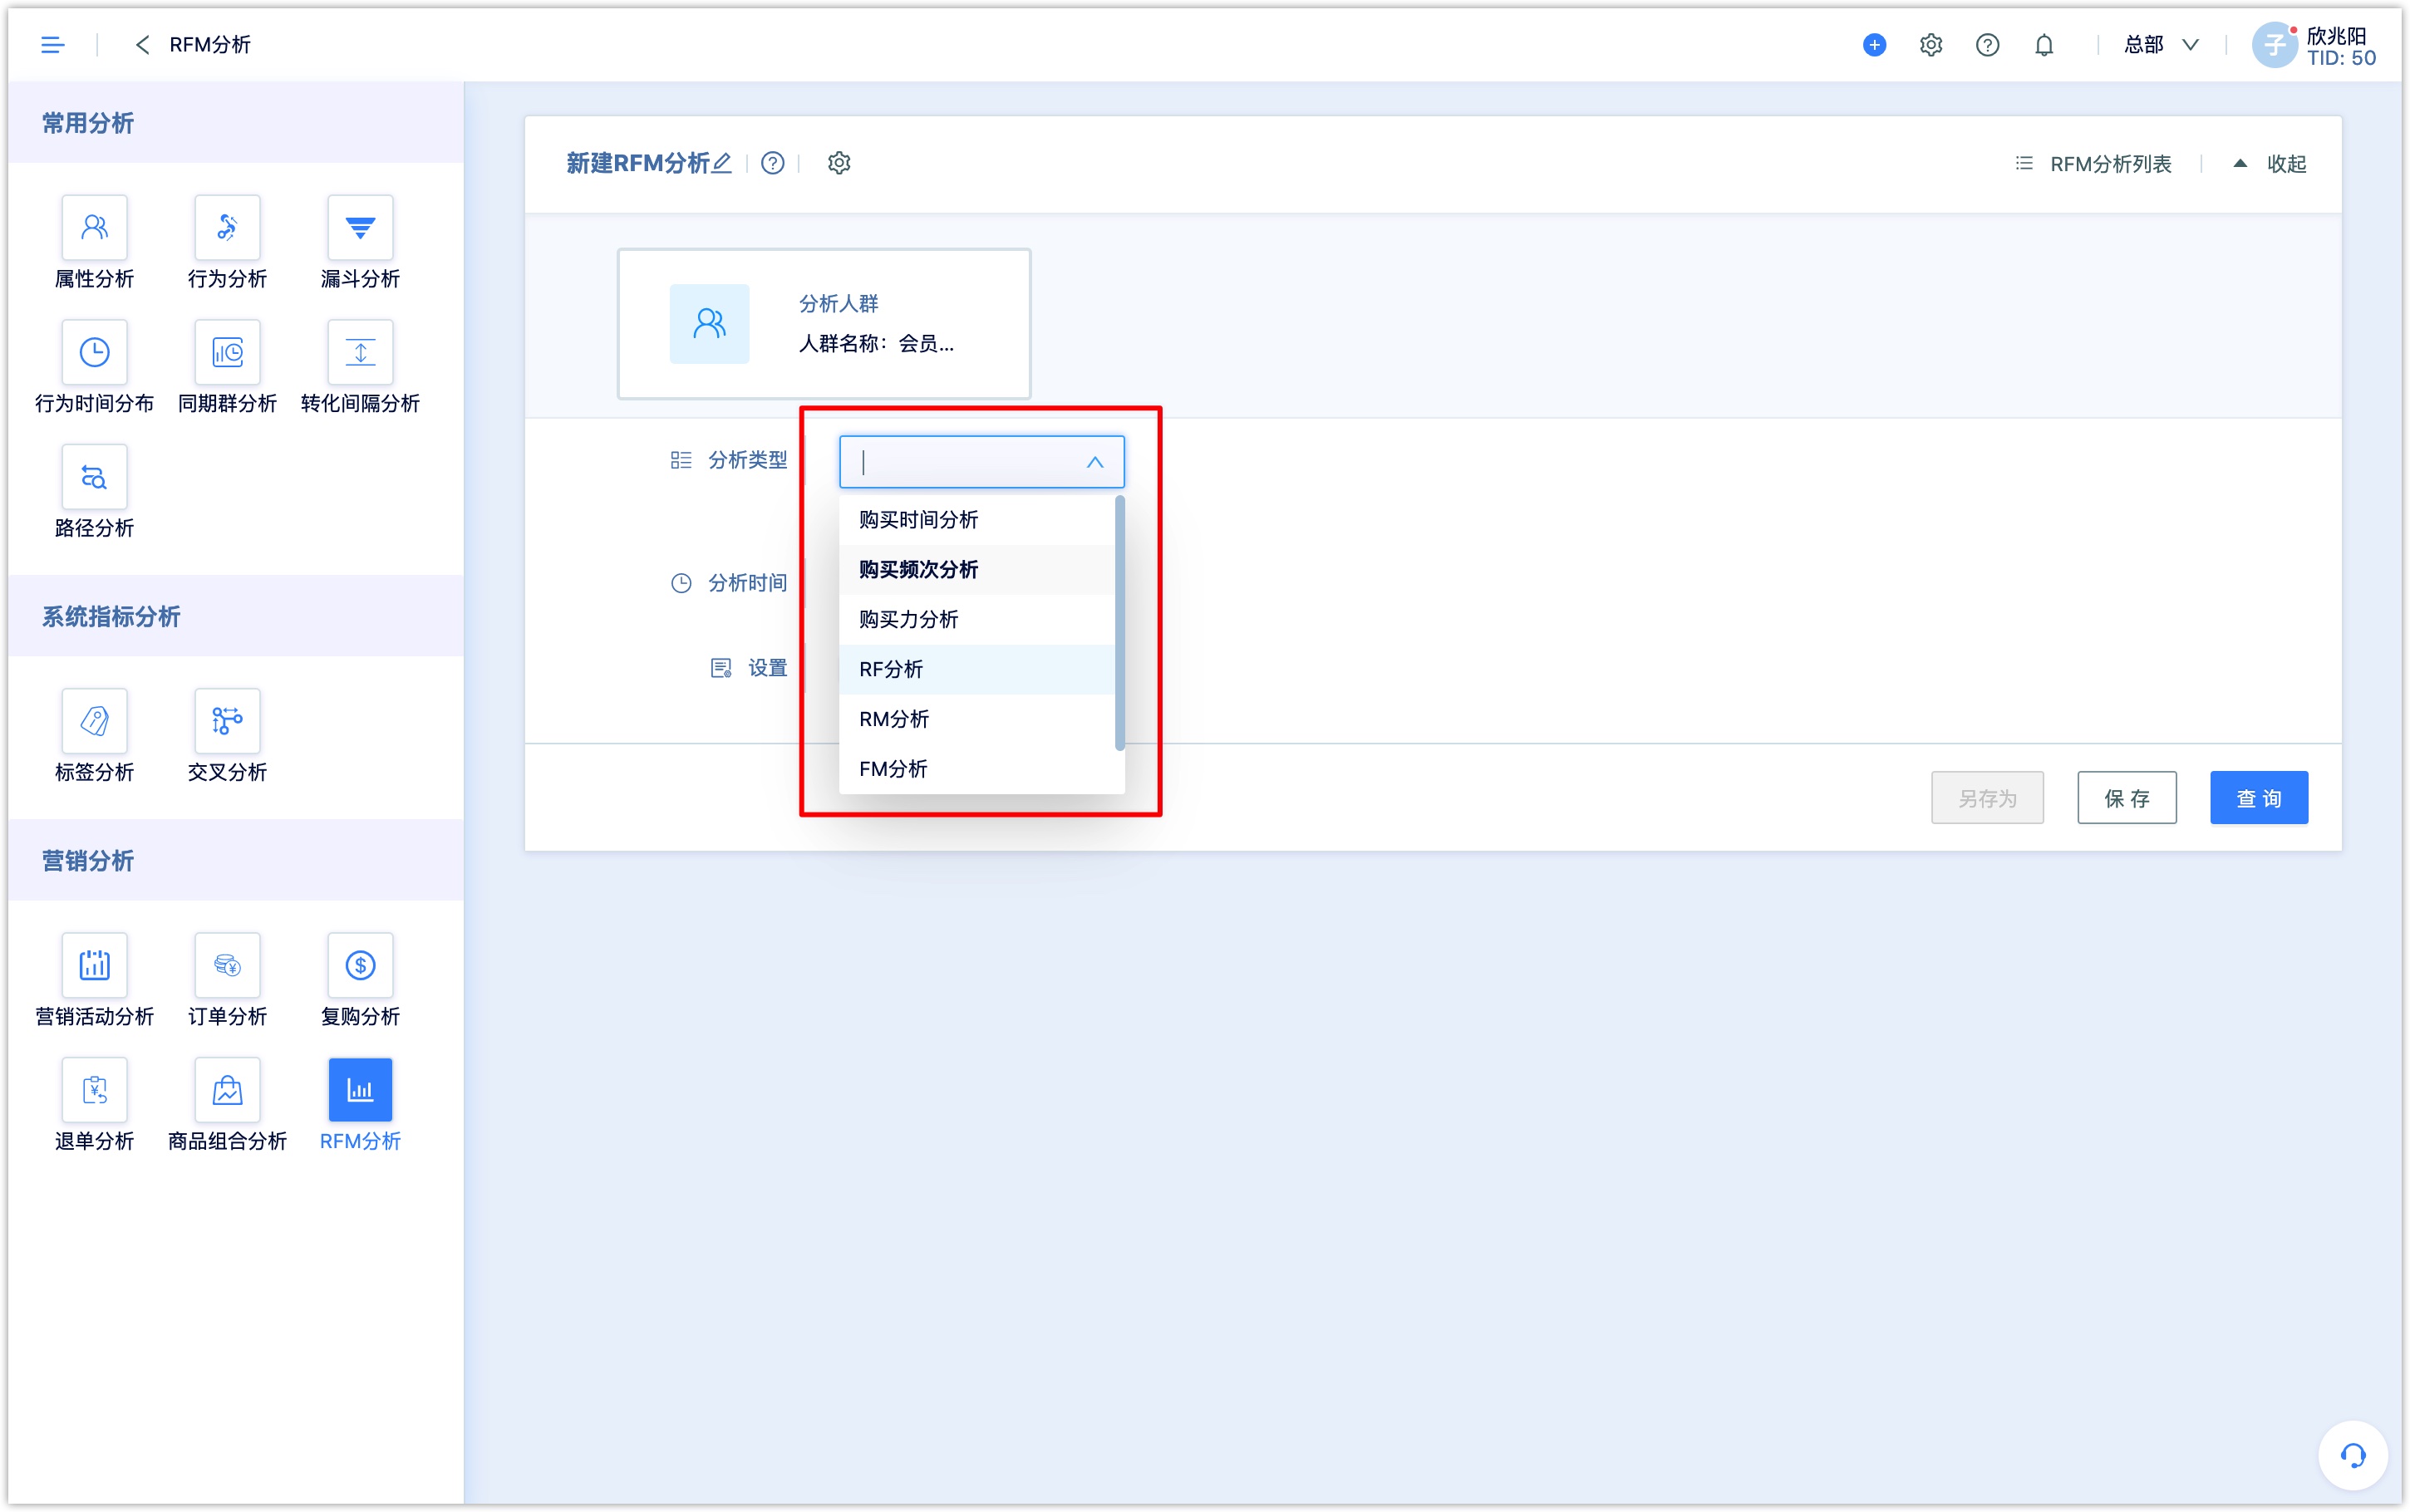
2.2Choose analysis type
The three latitudes of R value, F value, and M value can be combined to seven different analysis types: purchase time analysis, purchase frequency analysis, purchasing capacity analysis (total order amount, average order amount), RF analysis, RM analysis, FM analysis, RFM analysis.
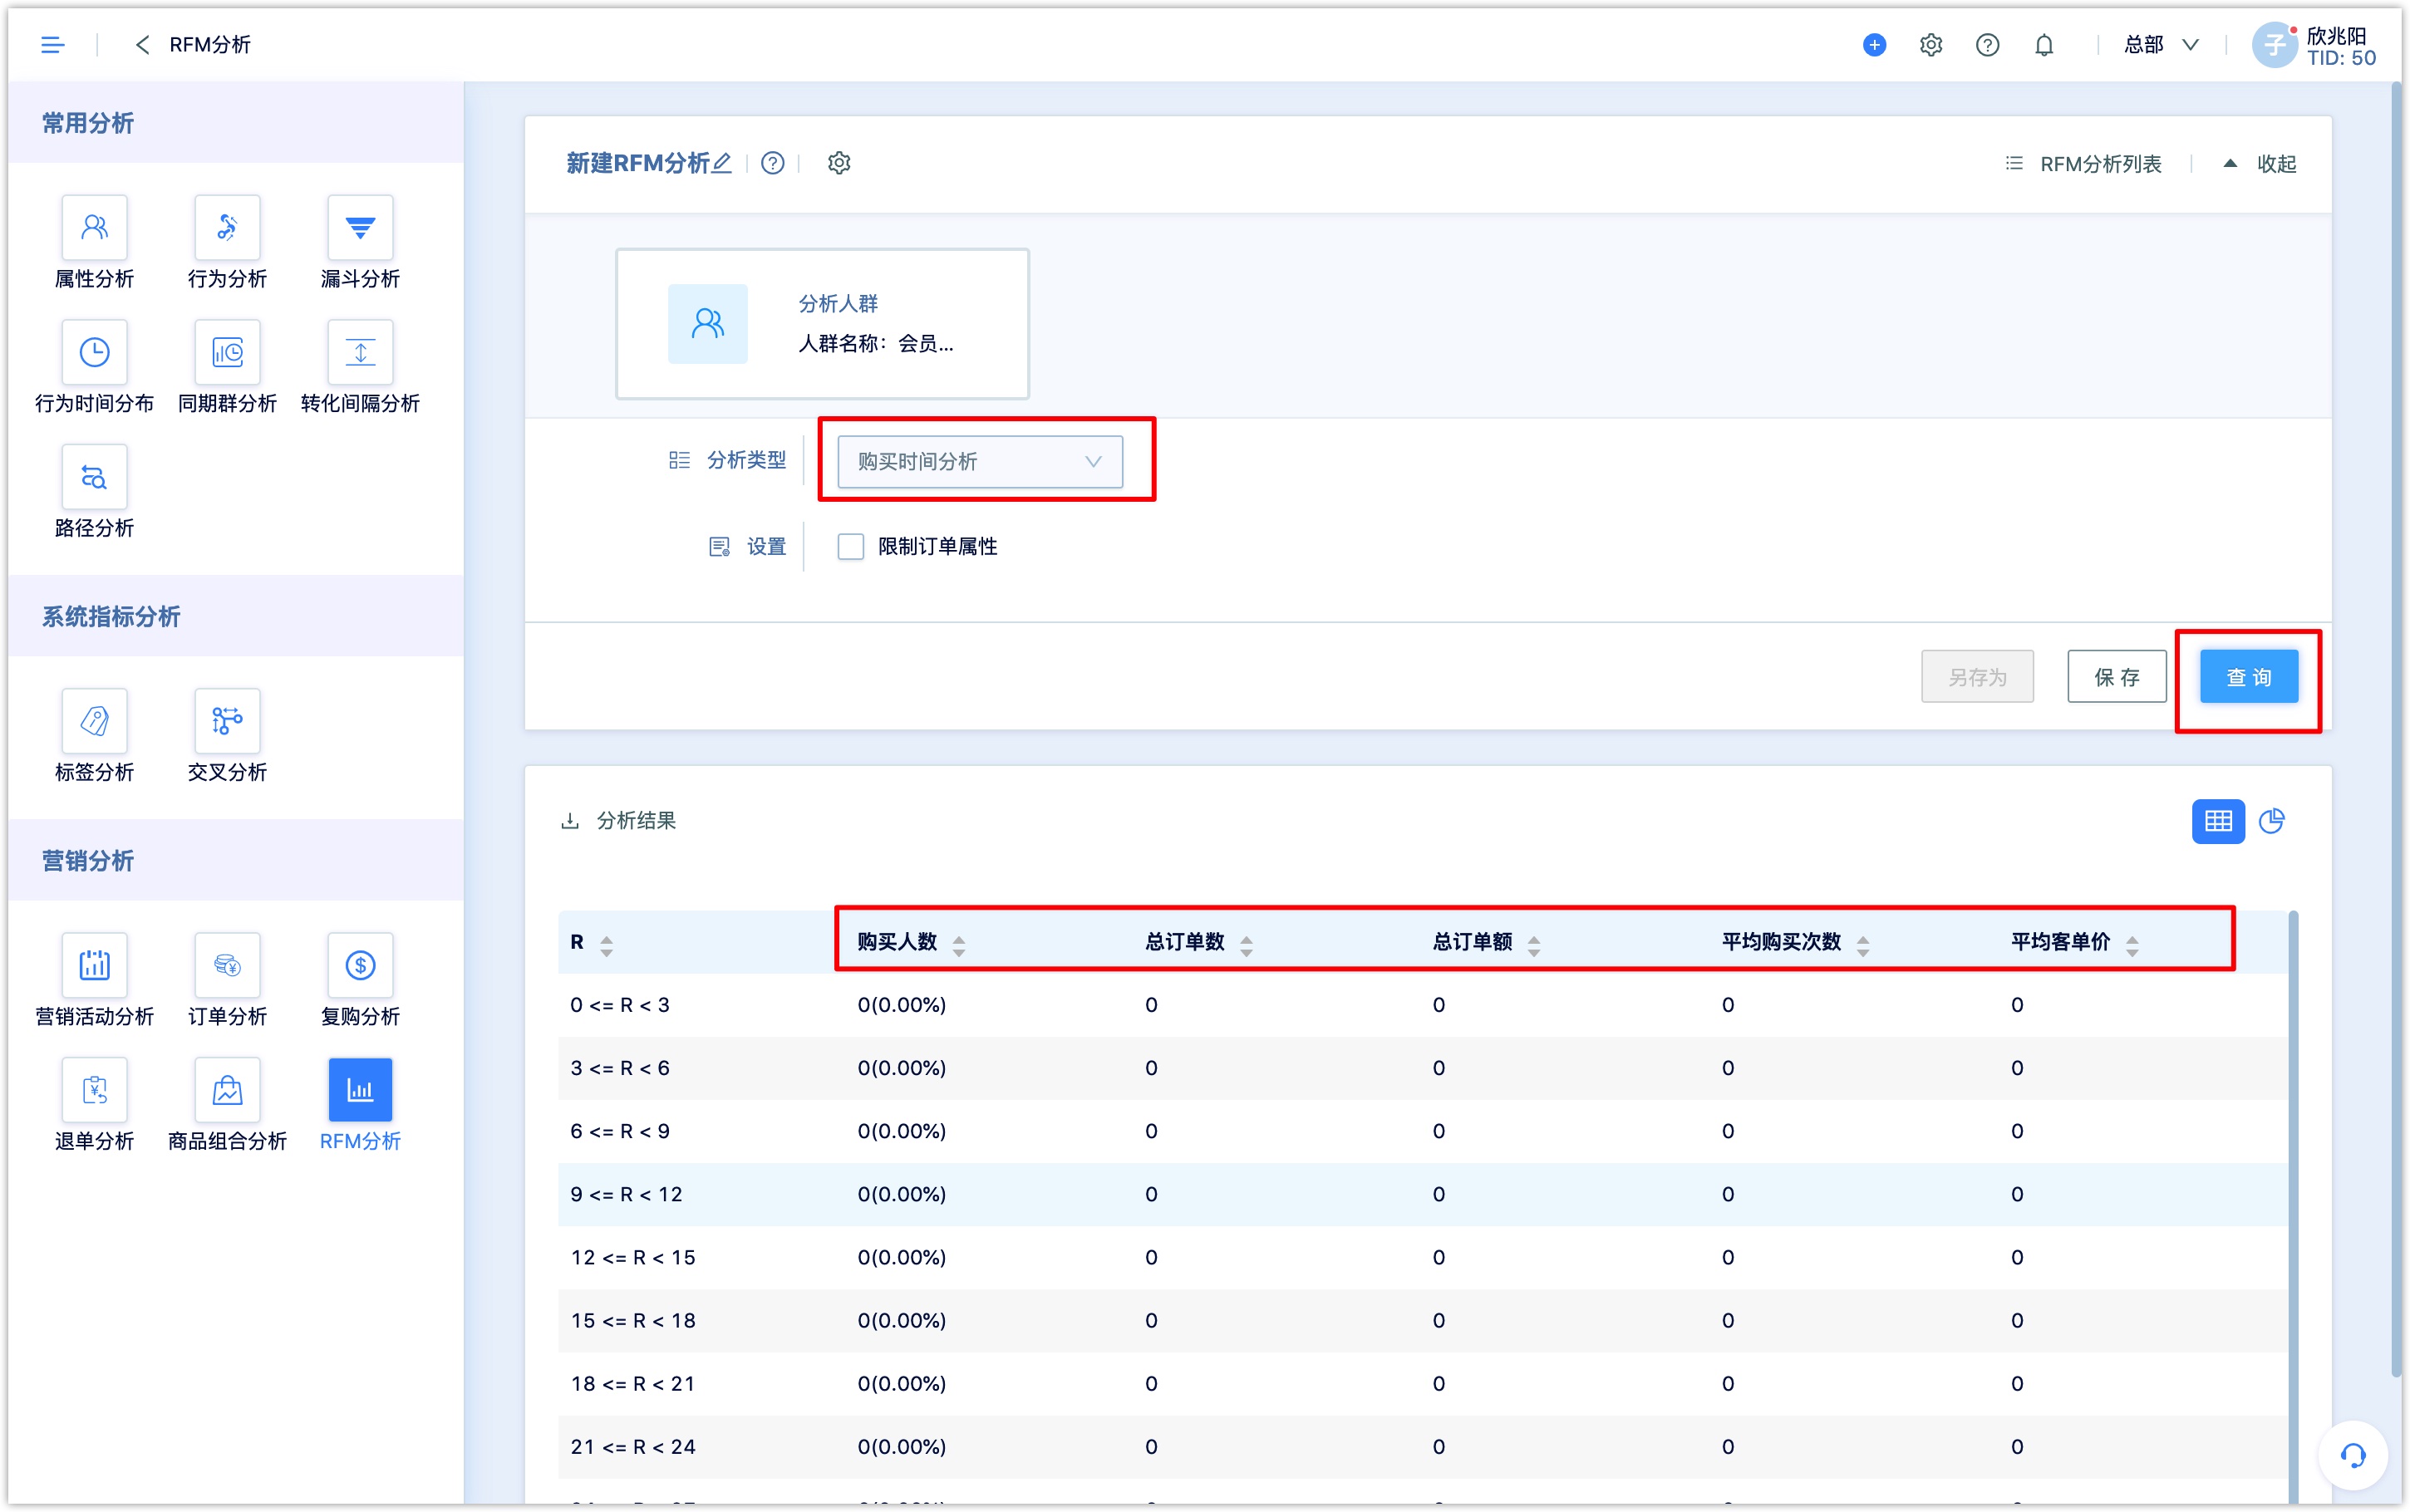
- Purchase time analysis:It is used to see the recent purchases of customers. The larger the R value, the more indicated that customers in this range have entered a period of silence. Through R analysis, we can clearly understand the recent purchases of customers in different time periods, such as the purchase amount and the number of orders.
Choose analysis type and analysis group, click query, the specific results of the order R value analysis will be displayed.
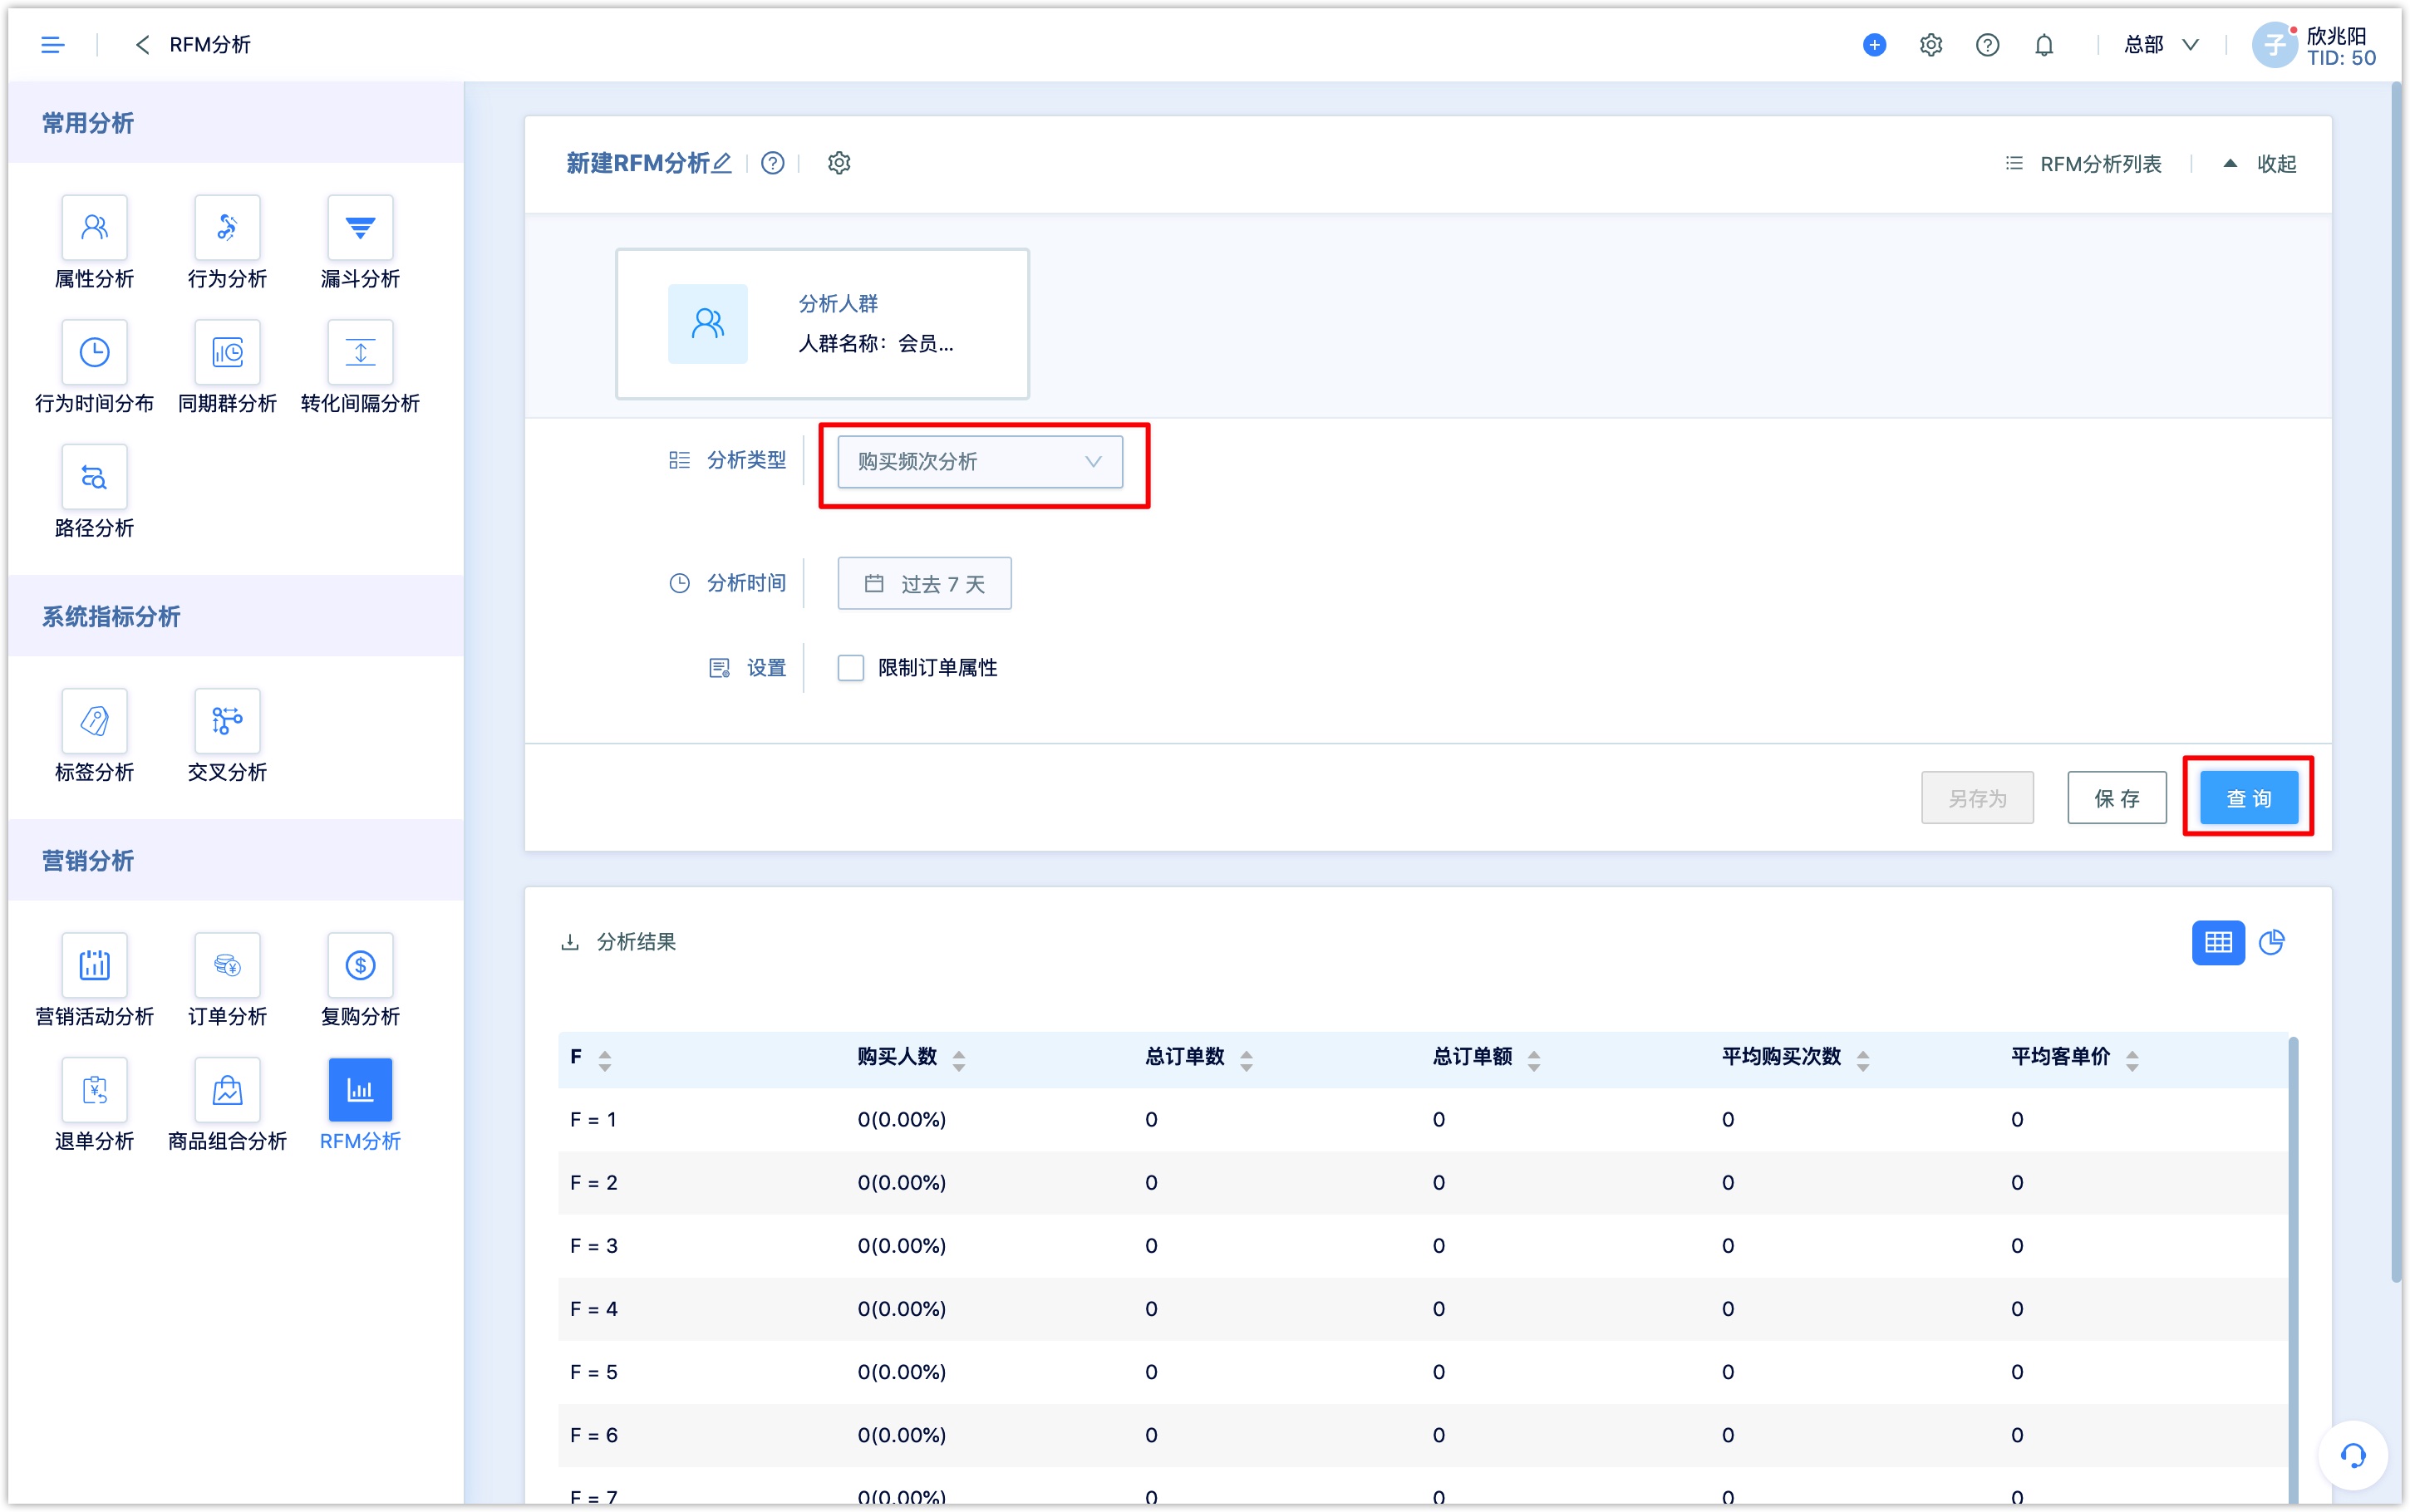
- Purchase frequency analysis:analyze the frequency of customer purchases. You can choose different time periods for analysis according to your needs, and choice of absolute time and relative time is supported.
Through this analysis, the distribution of orders with different purchase frequencies in the selected time period can be observed. If the results show that the number of people with F = 1 is the majority, it is recommended to consider whether it is time for more marketing activities in the near future to promote customers to repurchase and increase customer purchase frequency.
Choose analysis type and analysis group, click query, you can get the specific results of the order F value analysis.
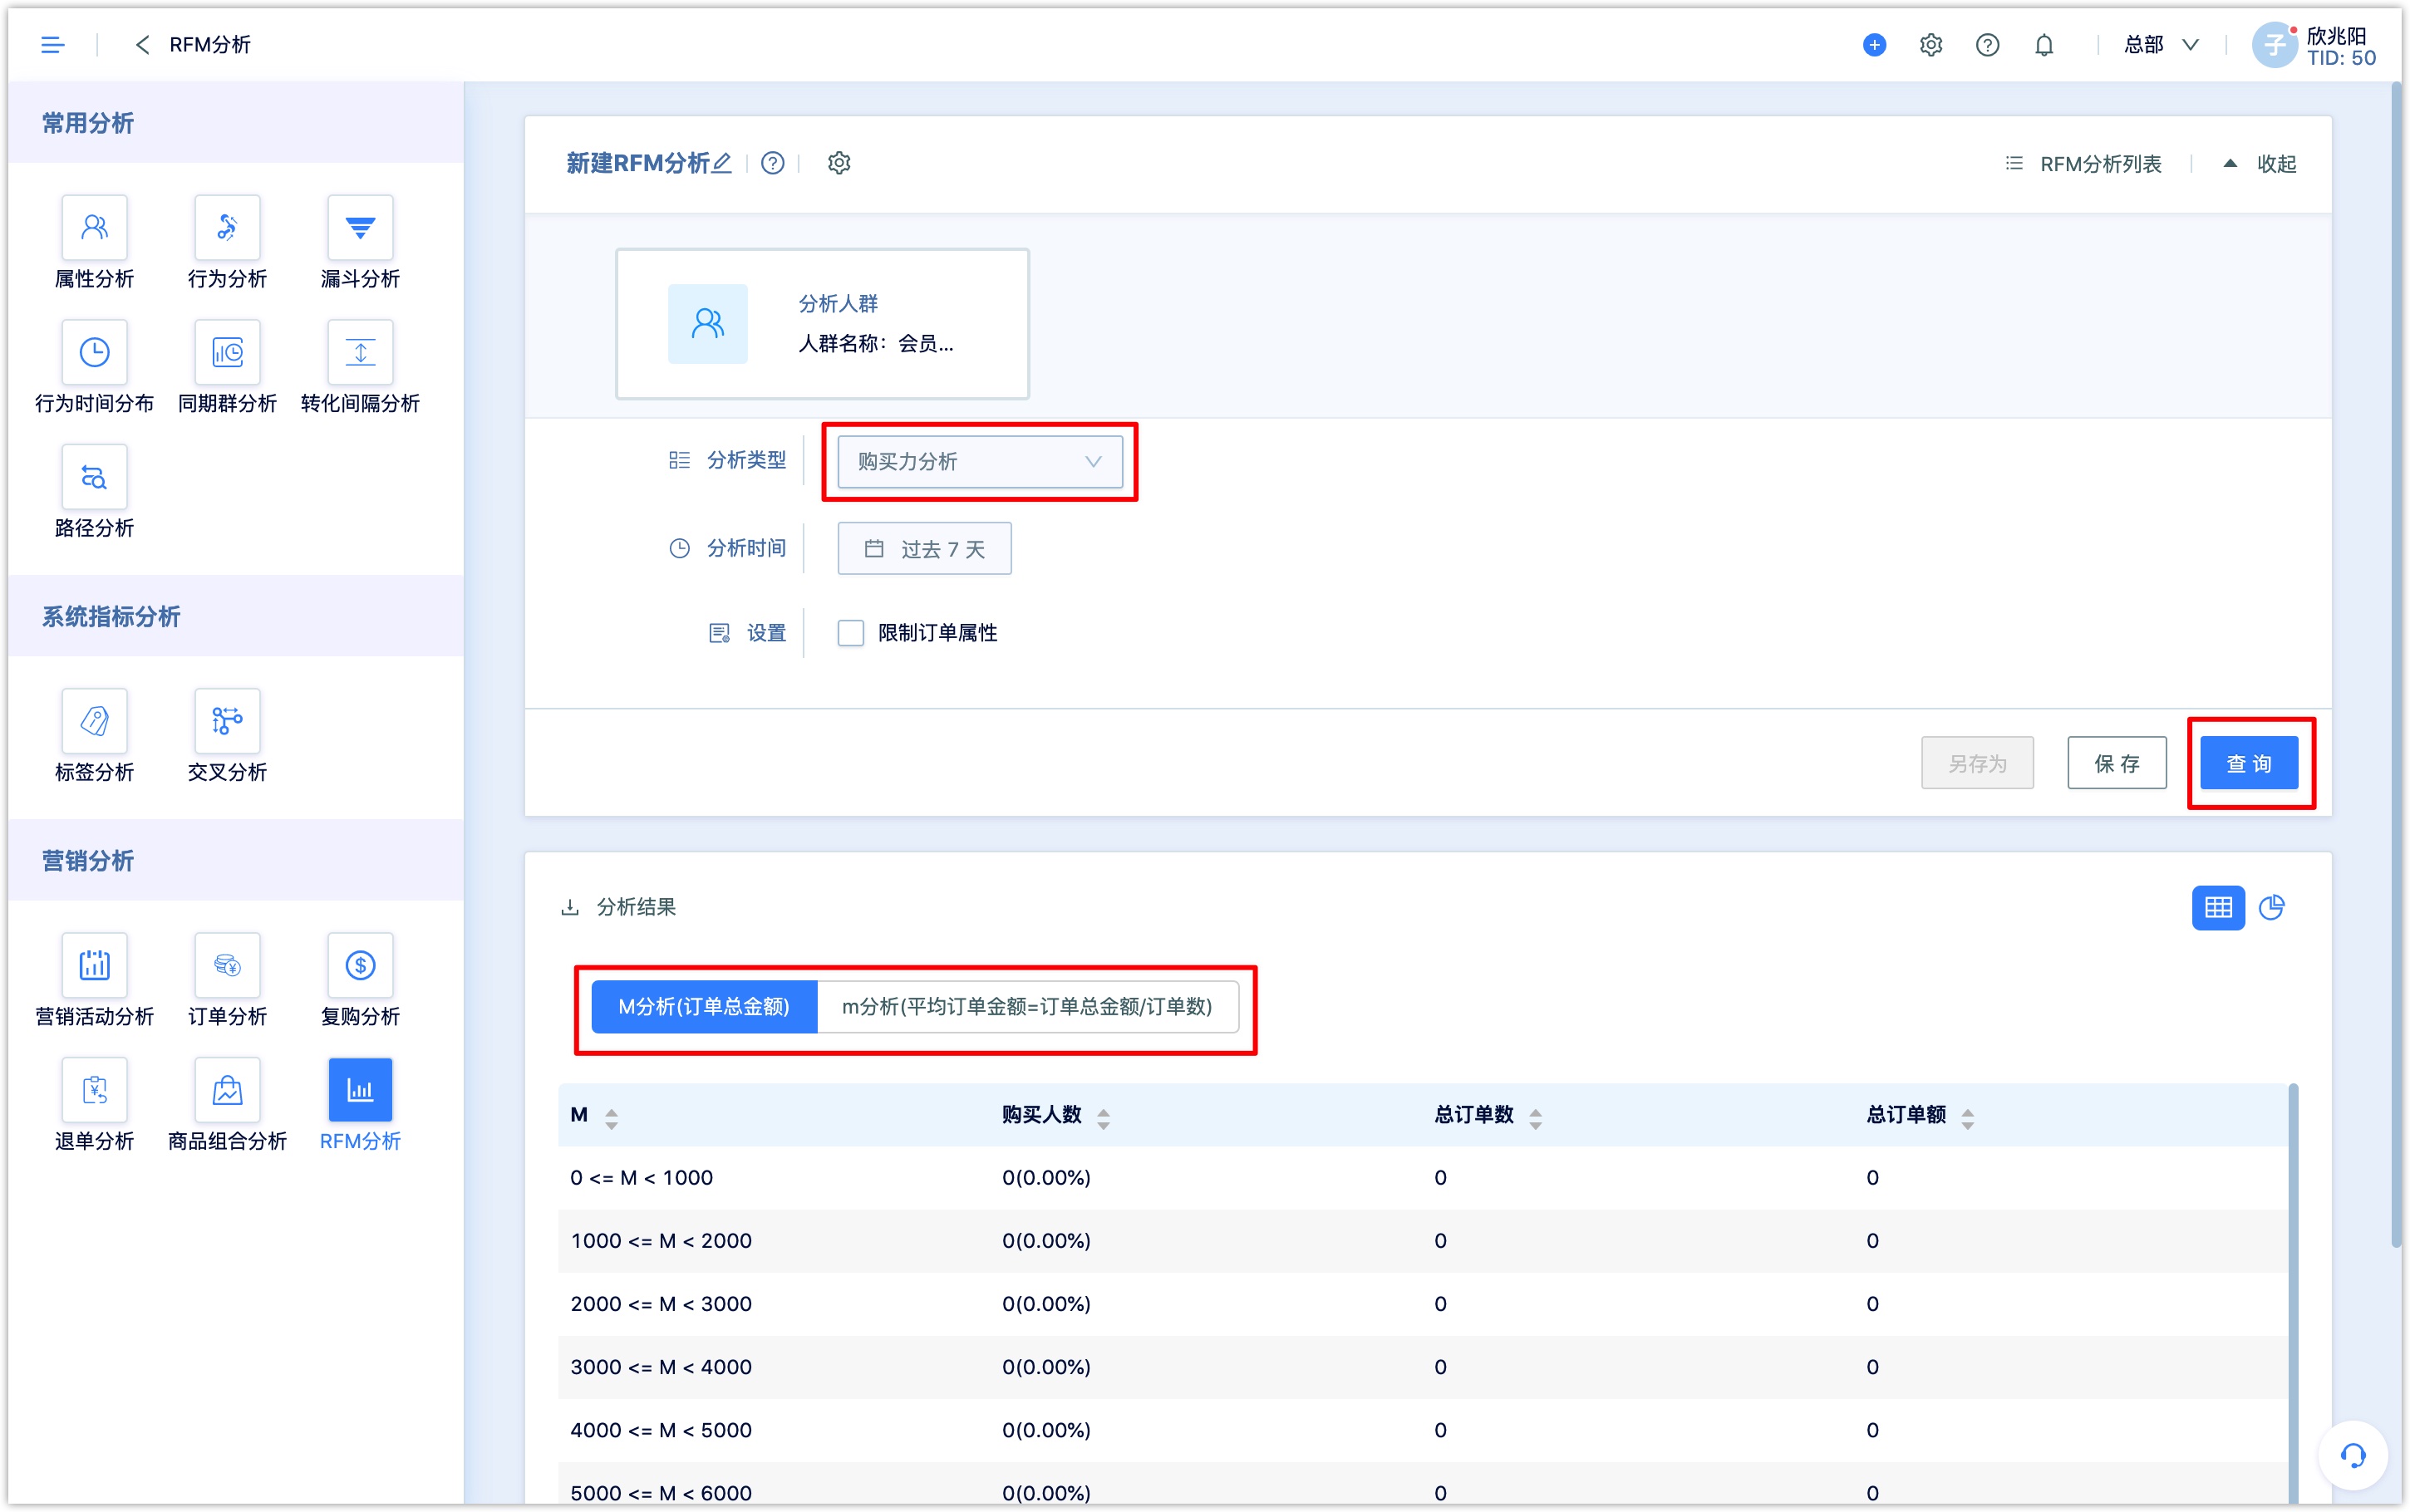
- Purchasing capacity analysis (total order amount, average order amount):M analysis is divided into two types: the capital M (total order amount) and the lowercase m (average order amount). Viewing the distribution of the two types of order amounts can provide a more comprehensive understanding of the distribution of customer orders. You can set different amount ranges for M and m respectively.
Choose analysis type and analysis group, click query, you can get the specific results of the order M value analysis.
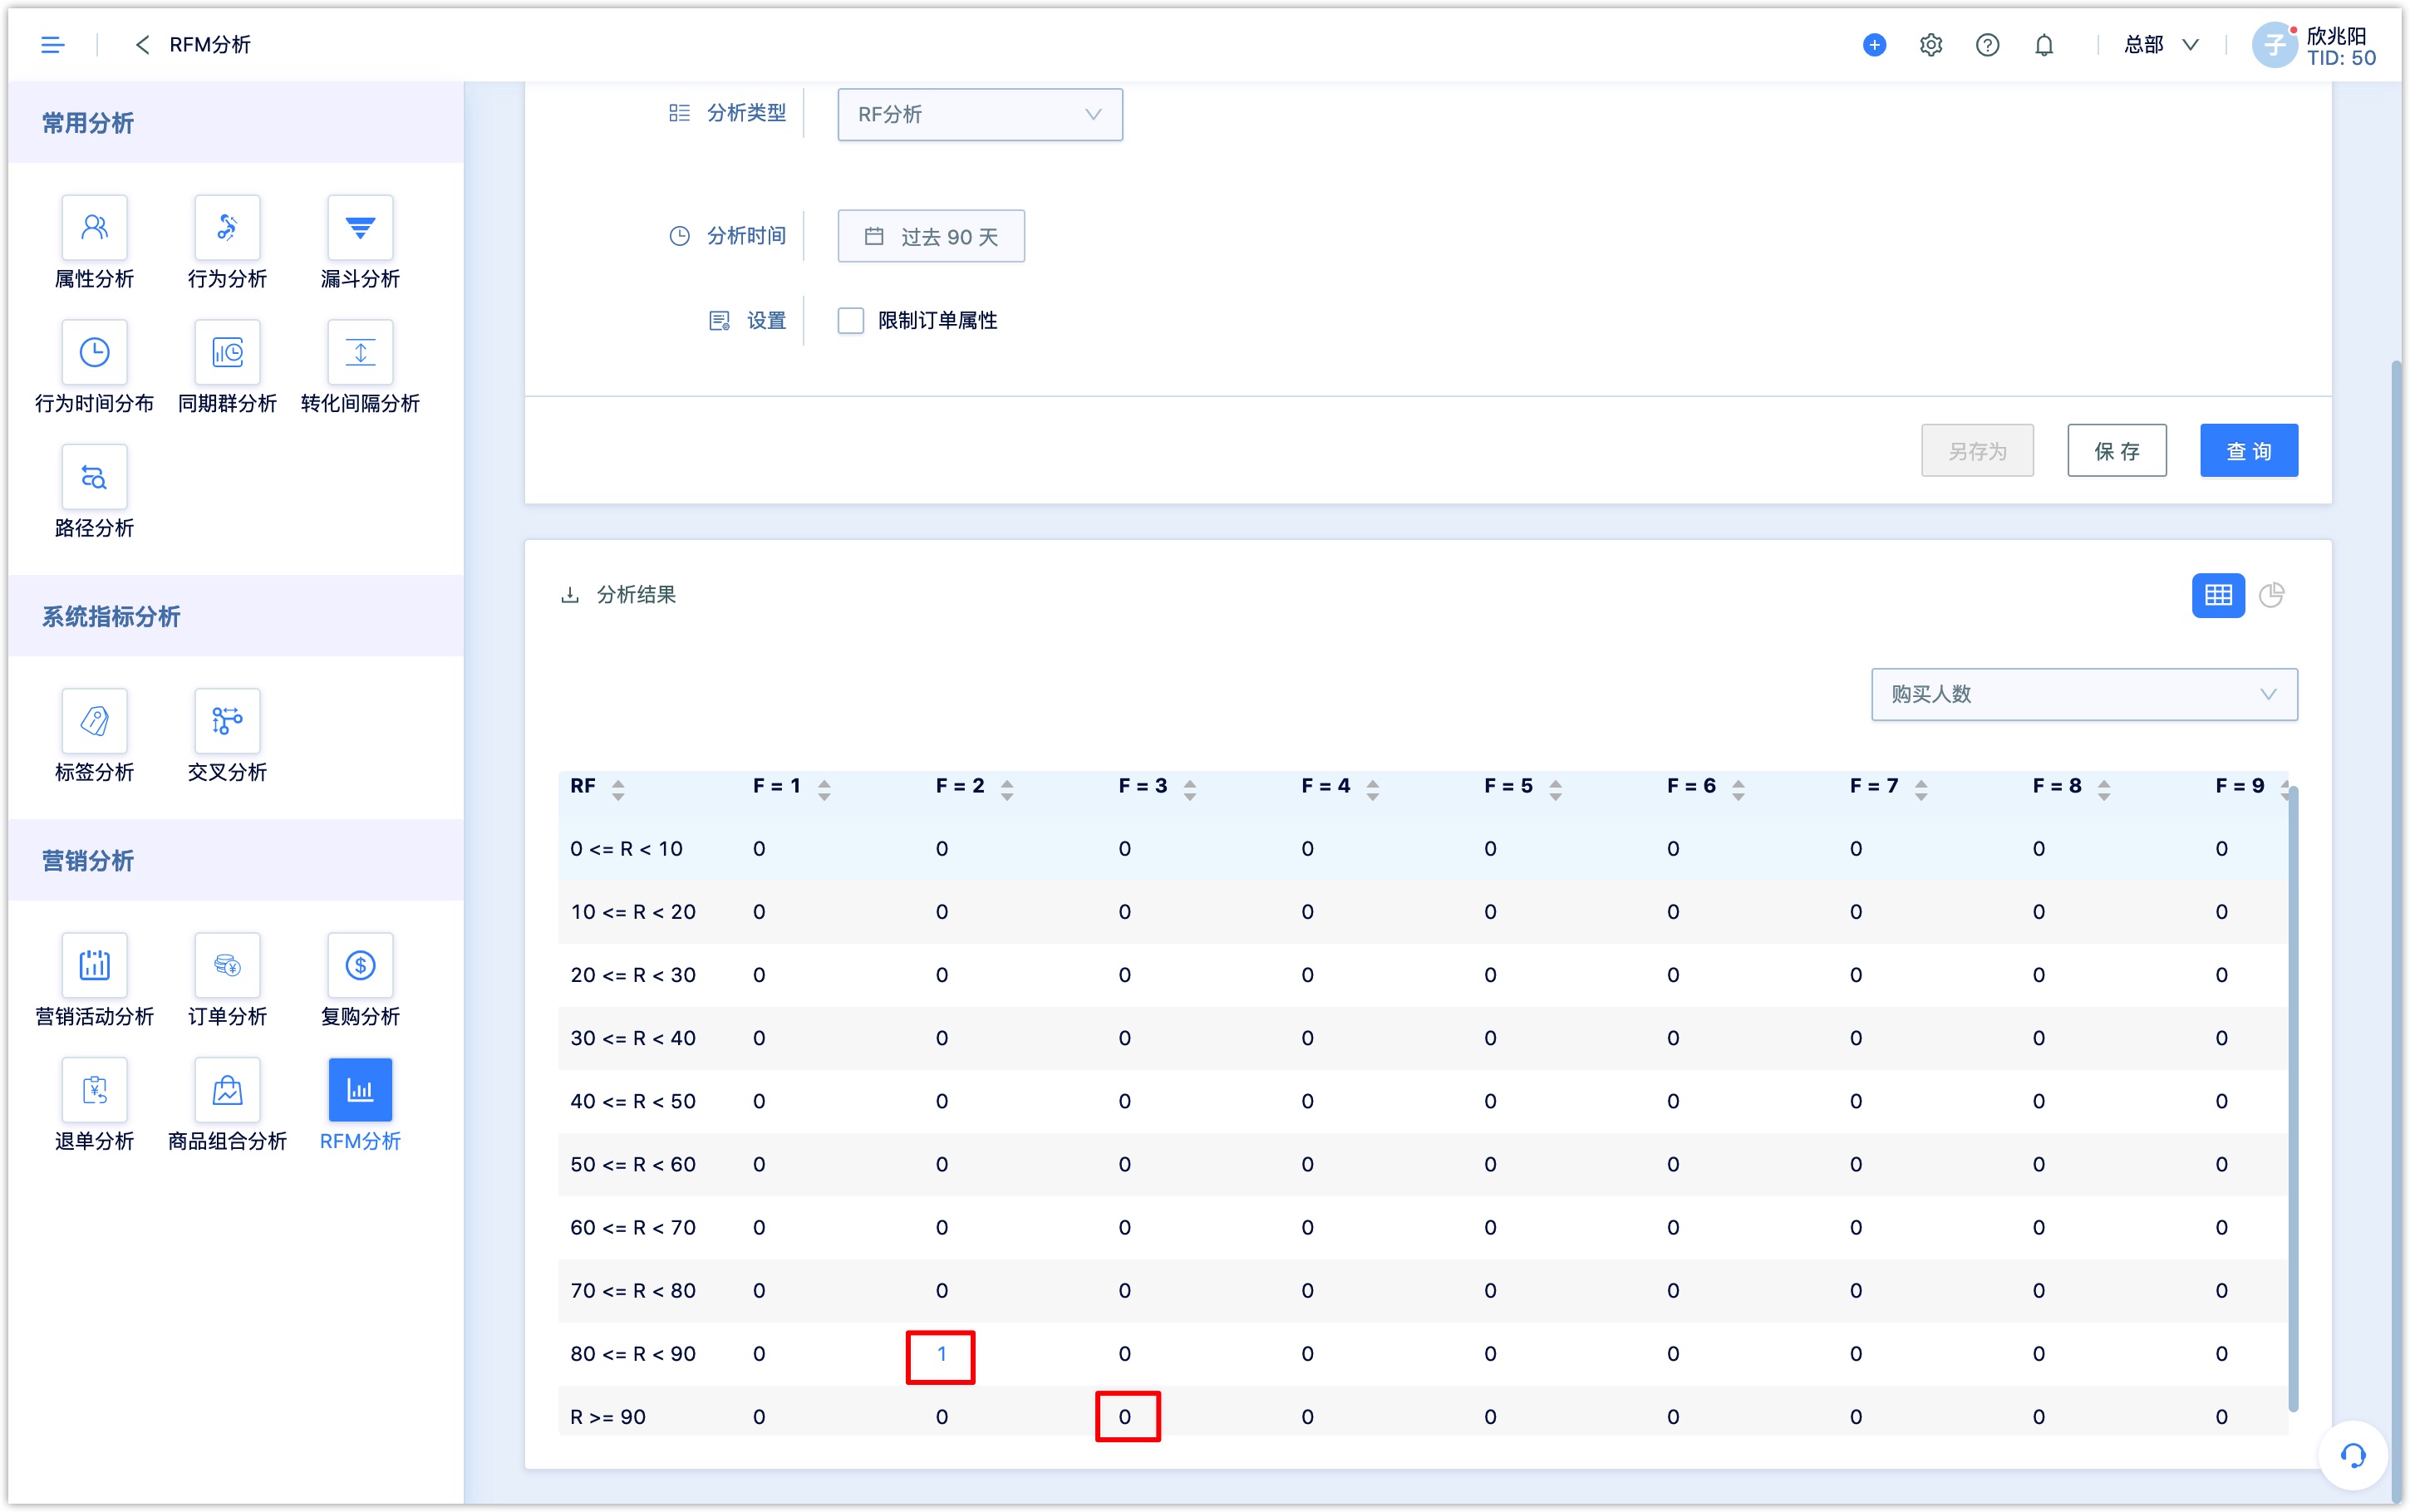
- RF analysis:RF analysis is be used to observe the order indicators of customers who have recently purchased orders at different purchase frequencies and understand the customer's recent activity in different time periods. For example, the smaller the R value of the time interval, the larger the F value at the same time, and the larger number of customers and orders in the interval, indicating that the higher the conversion rate during the analysis time period.
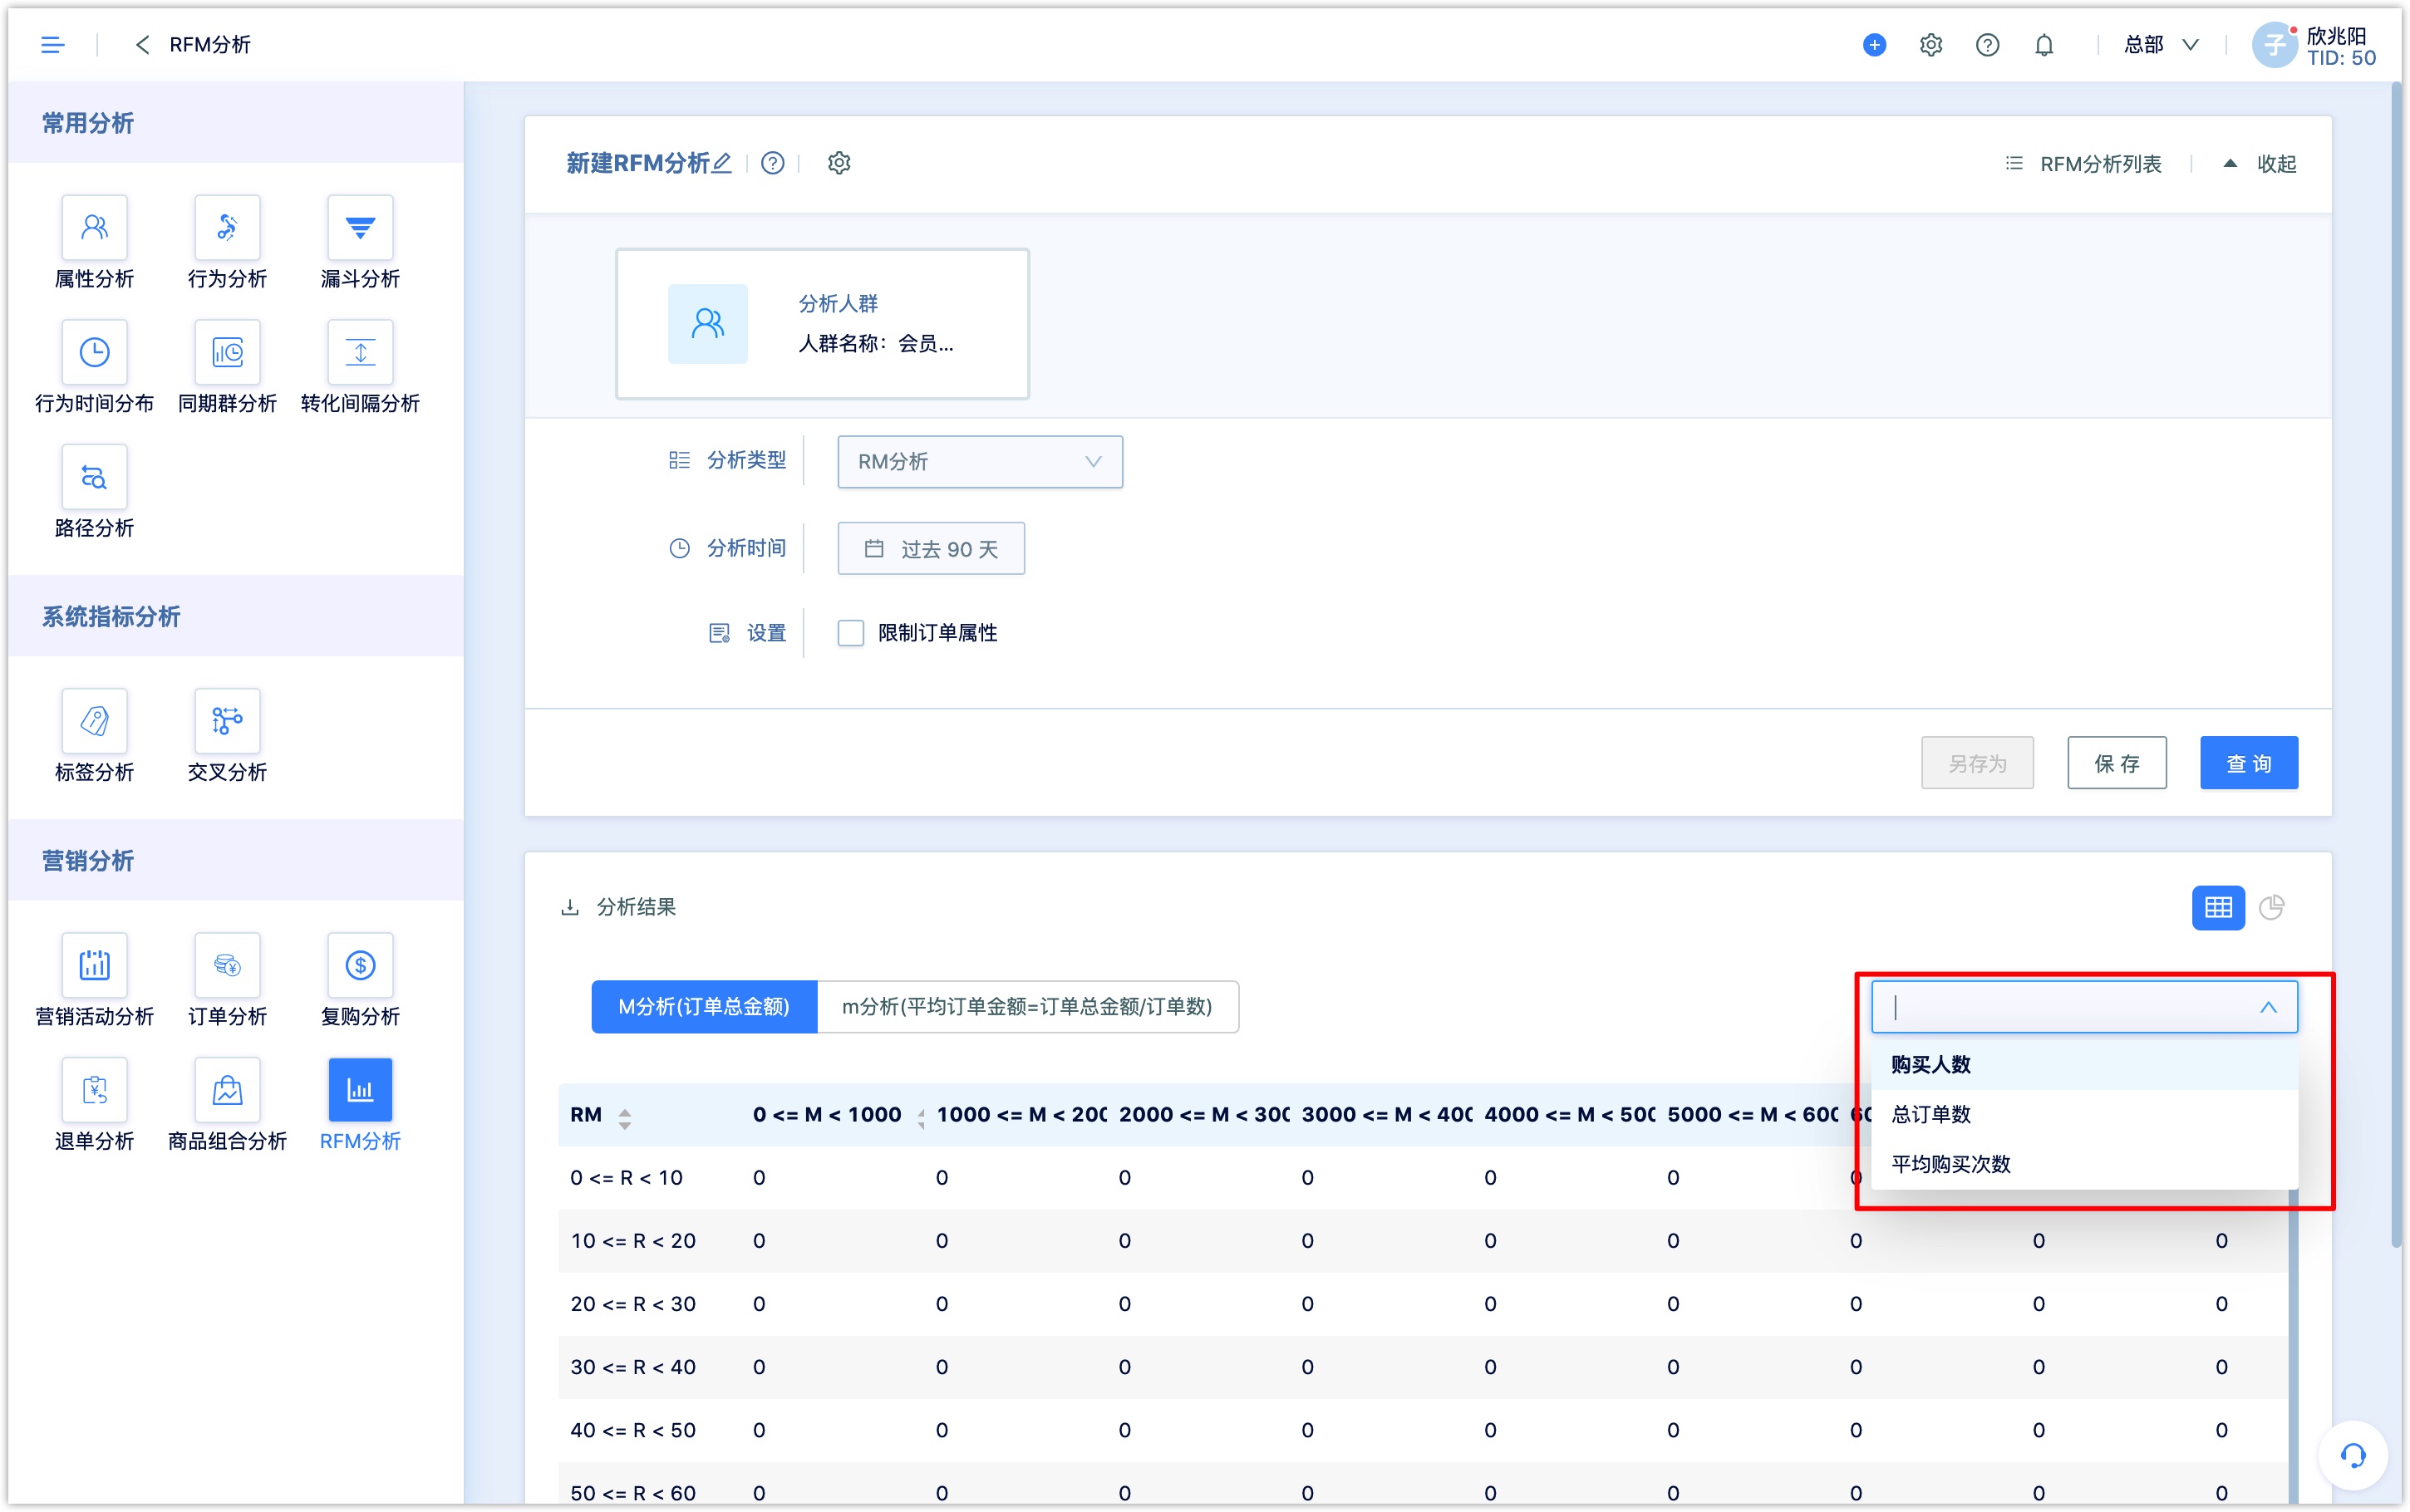
- RM analysis:in RM analysis, the M value can be analyzed based on the total order amount and the average order amount. Some indicators such as the number of customers at different amounts the total number of orders, and the average number of purchases can be analyzed, among whom have recently purchased.
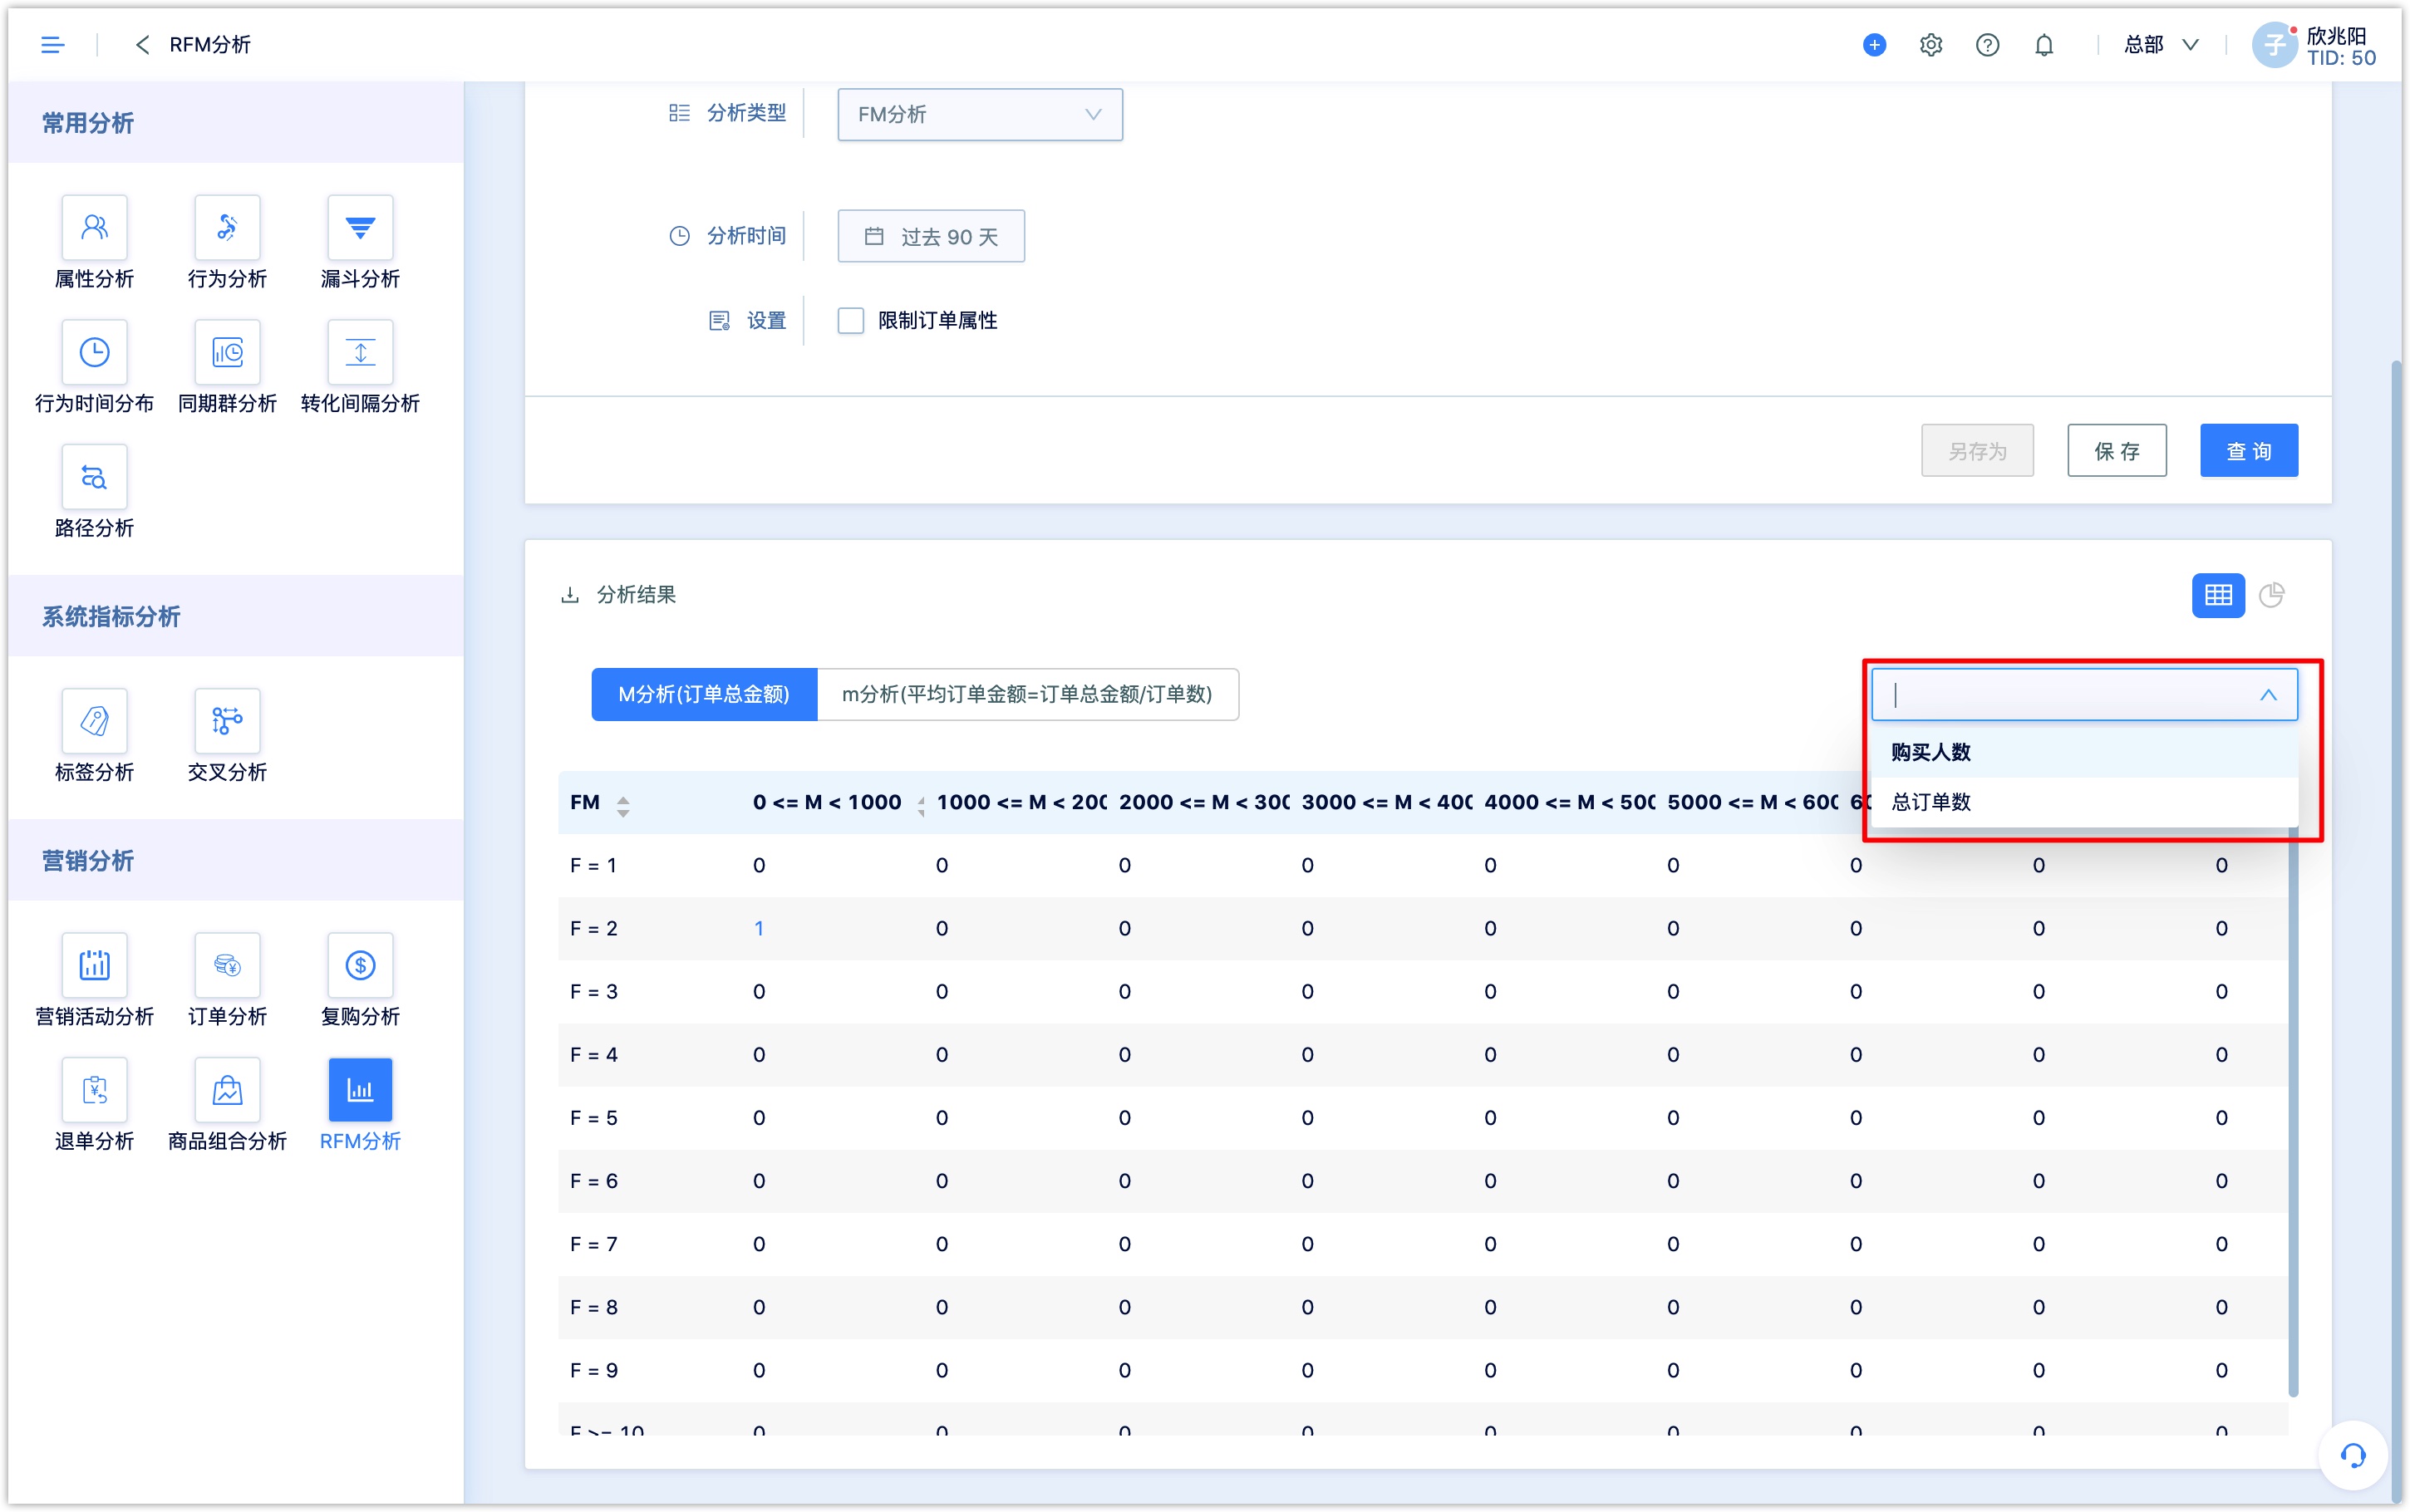
- FM analysis:The M value in FM analysis can be analyzed and viewed based on the total order amount and the average order amount. Through this analysis, it is possible to obtain the order amount distribution under different order frequencies of customers.
Analysis indicators include the number of purchasers and the total number of orders.
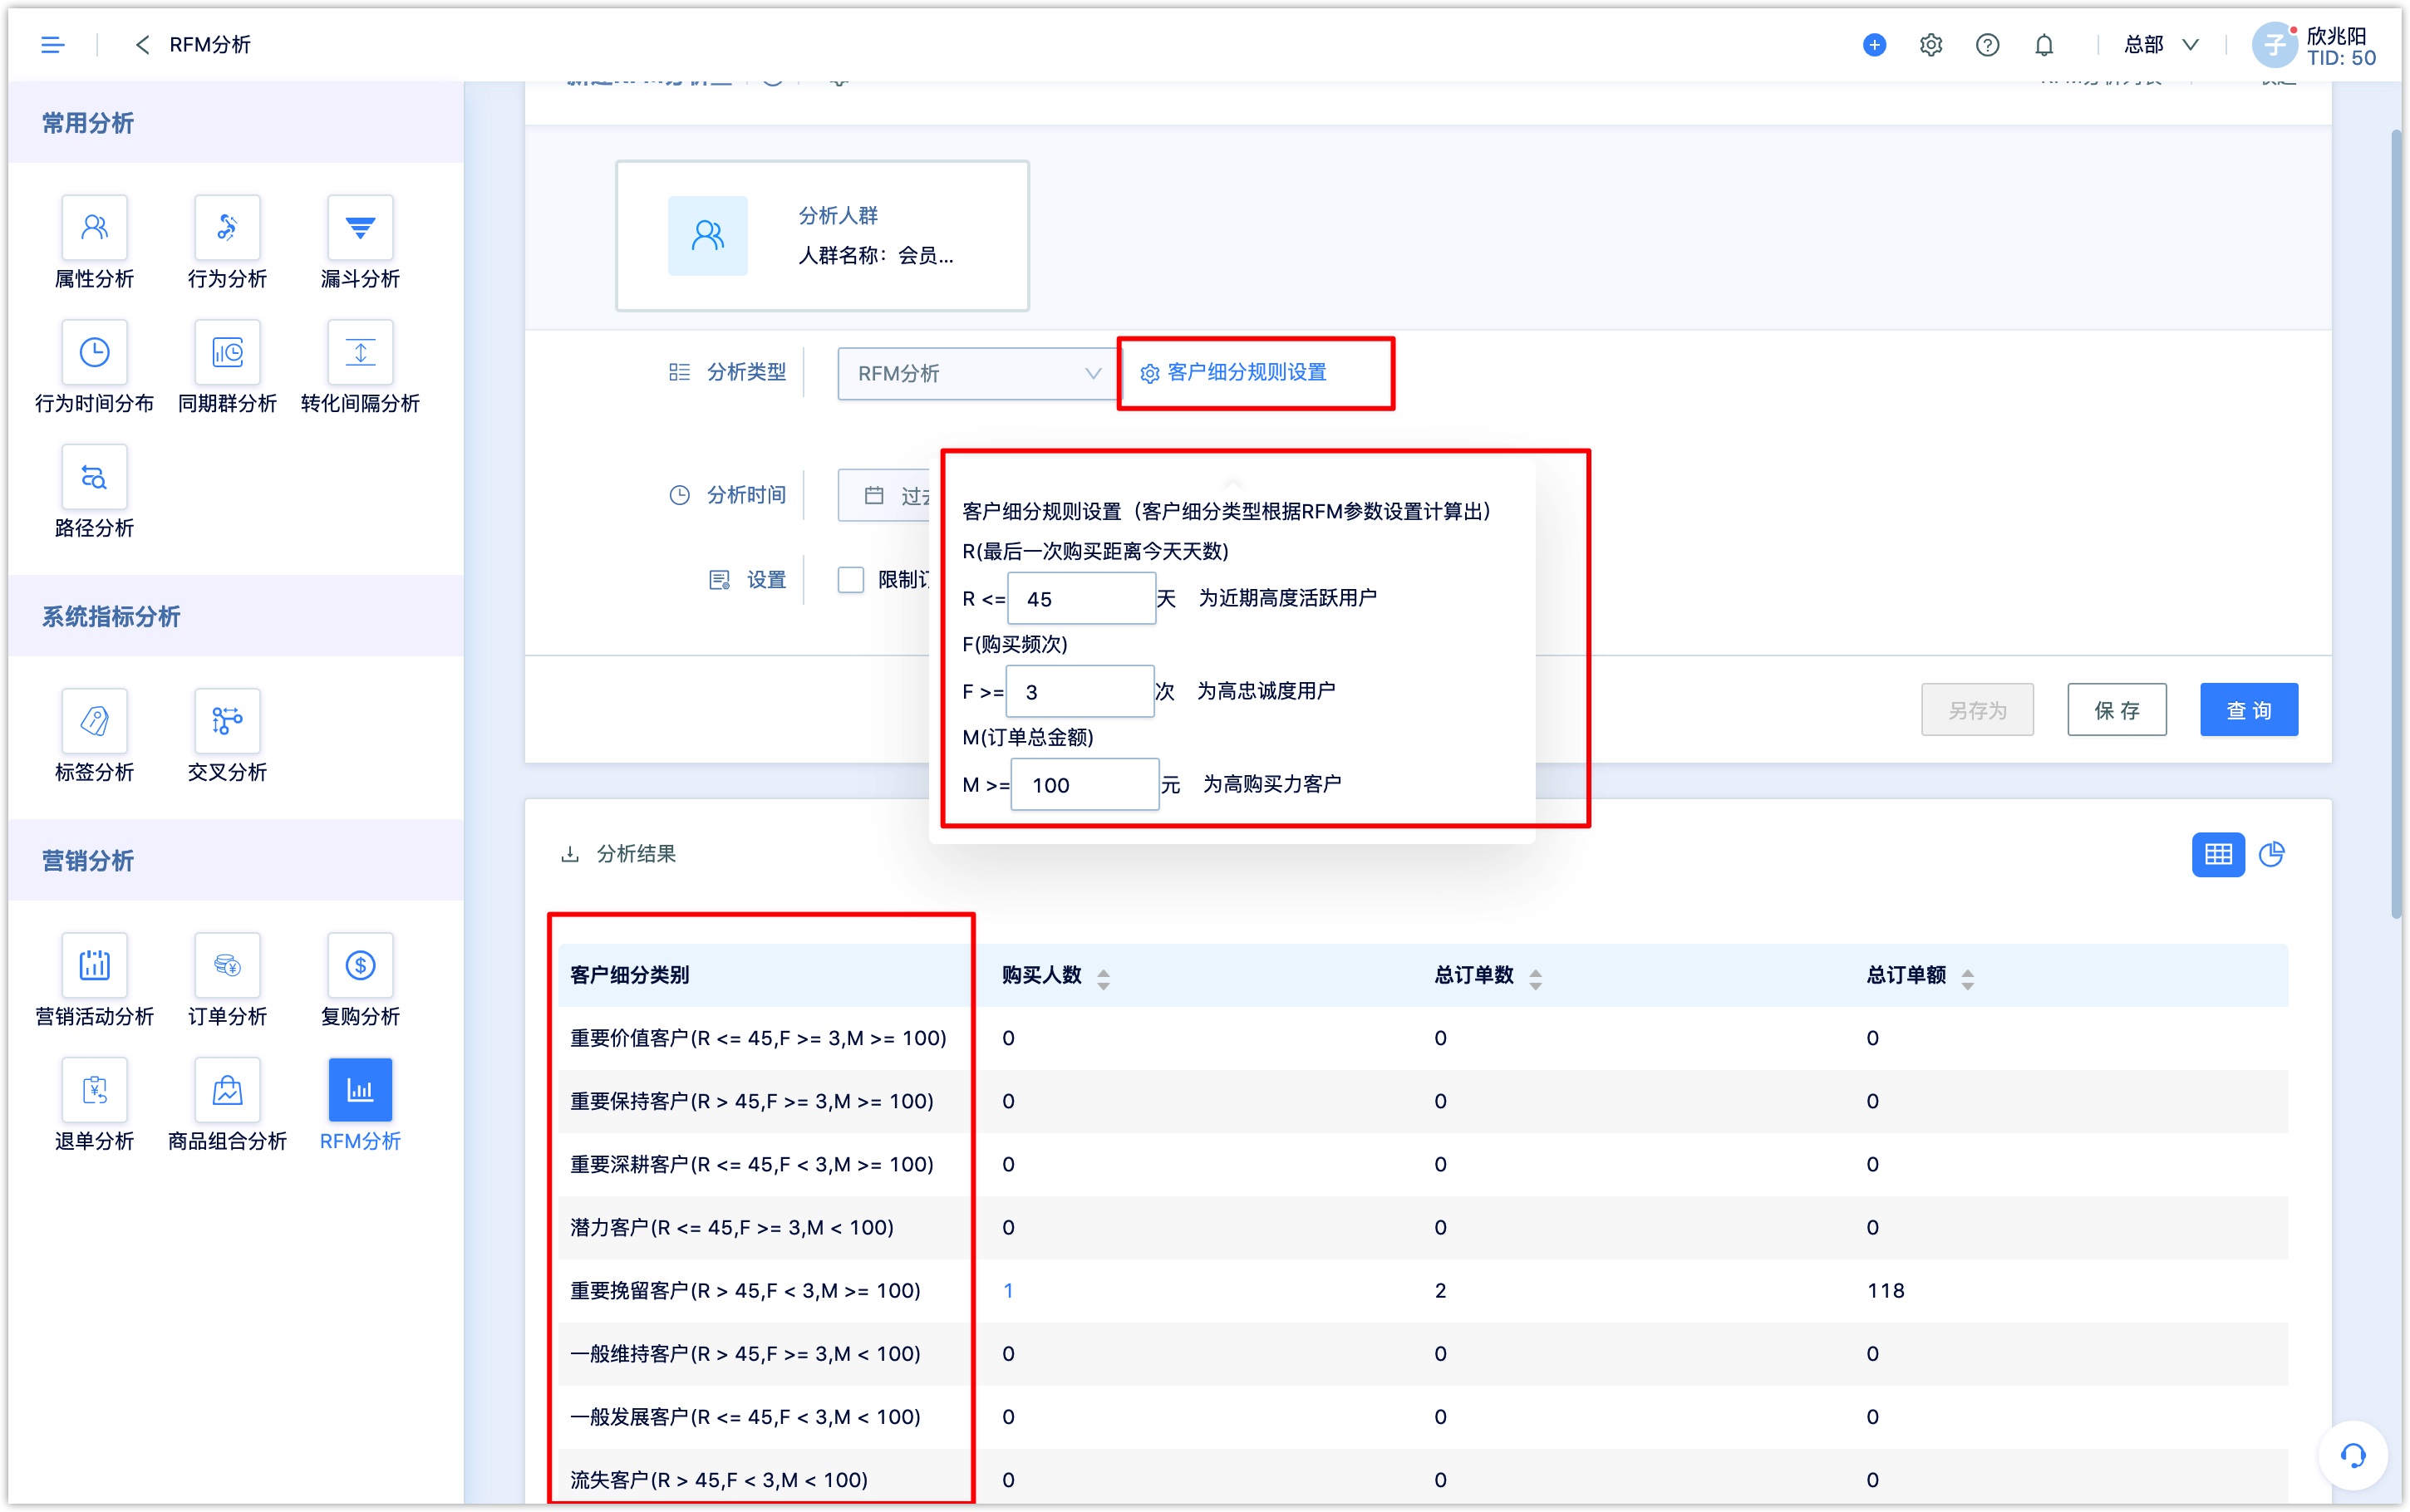
- RFM Analysis:RFM analysis simplifies the classification results by measuring whether the R, F, and M values of each customer are above the average. Because there are only two results (less than the average and greater than the average) for R, F, and M after each customer’s value is compared with the average. There are 8 groups in the overall combination, which is a relatively reasonable classification.