Behavior analysis
1.Why is behavior analysis needed?
Behavior analysis is based on all customer event data in the system. Behavior analysis can count the number of people, visits and trends of each behavior. So, it can answer the following questions:
- The number of followers following the official account every day in the past 7 days
- Order volume and sales revenue in recent months
- Which source places the most orders
- Comparison of the number of people following WeChat account and unfollowing in the past month
According to the company's own situation and reasonable configuration, it can answer various subdivision questions about changing trends and dimension comparisons.
2.Process guide
2.1Select analysis type
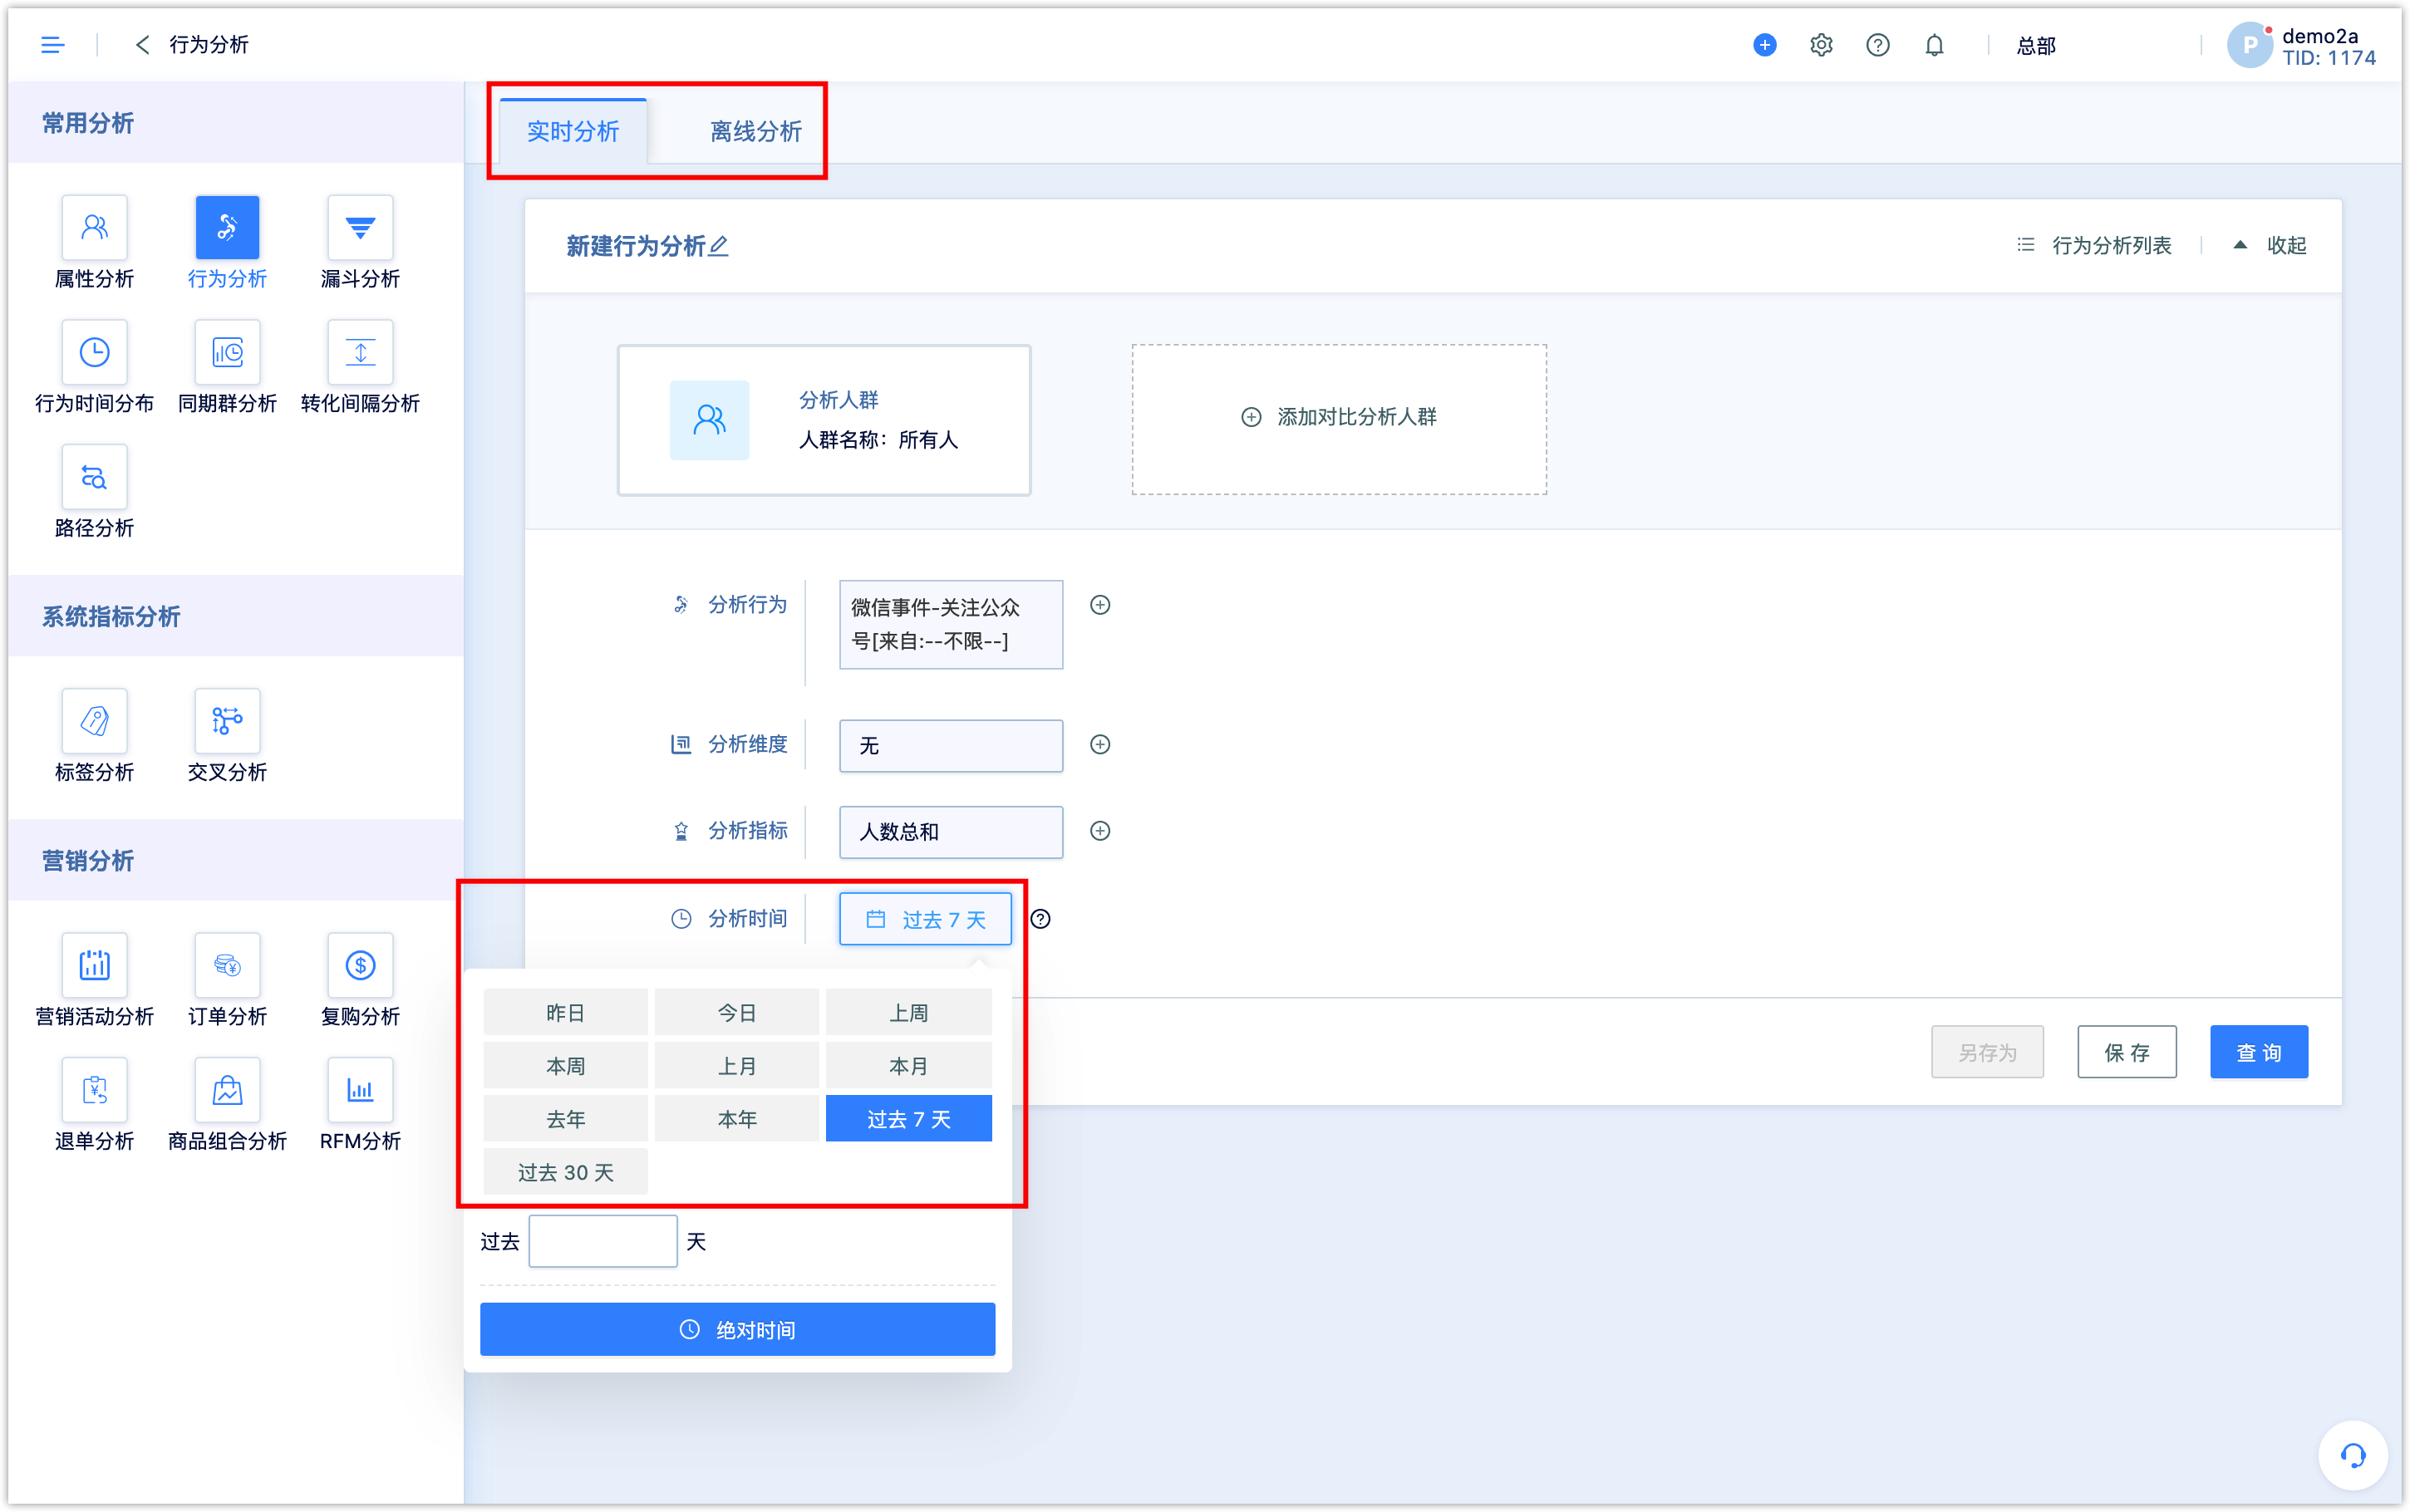
Both real-time analysis and offline analysis is supported for behavior analysis. Real-time supports data analysis within 365 days, and offline analysis supports full-time data analysis.
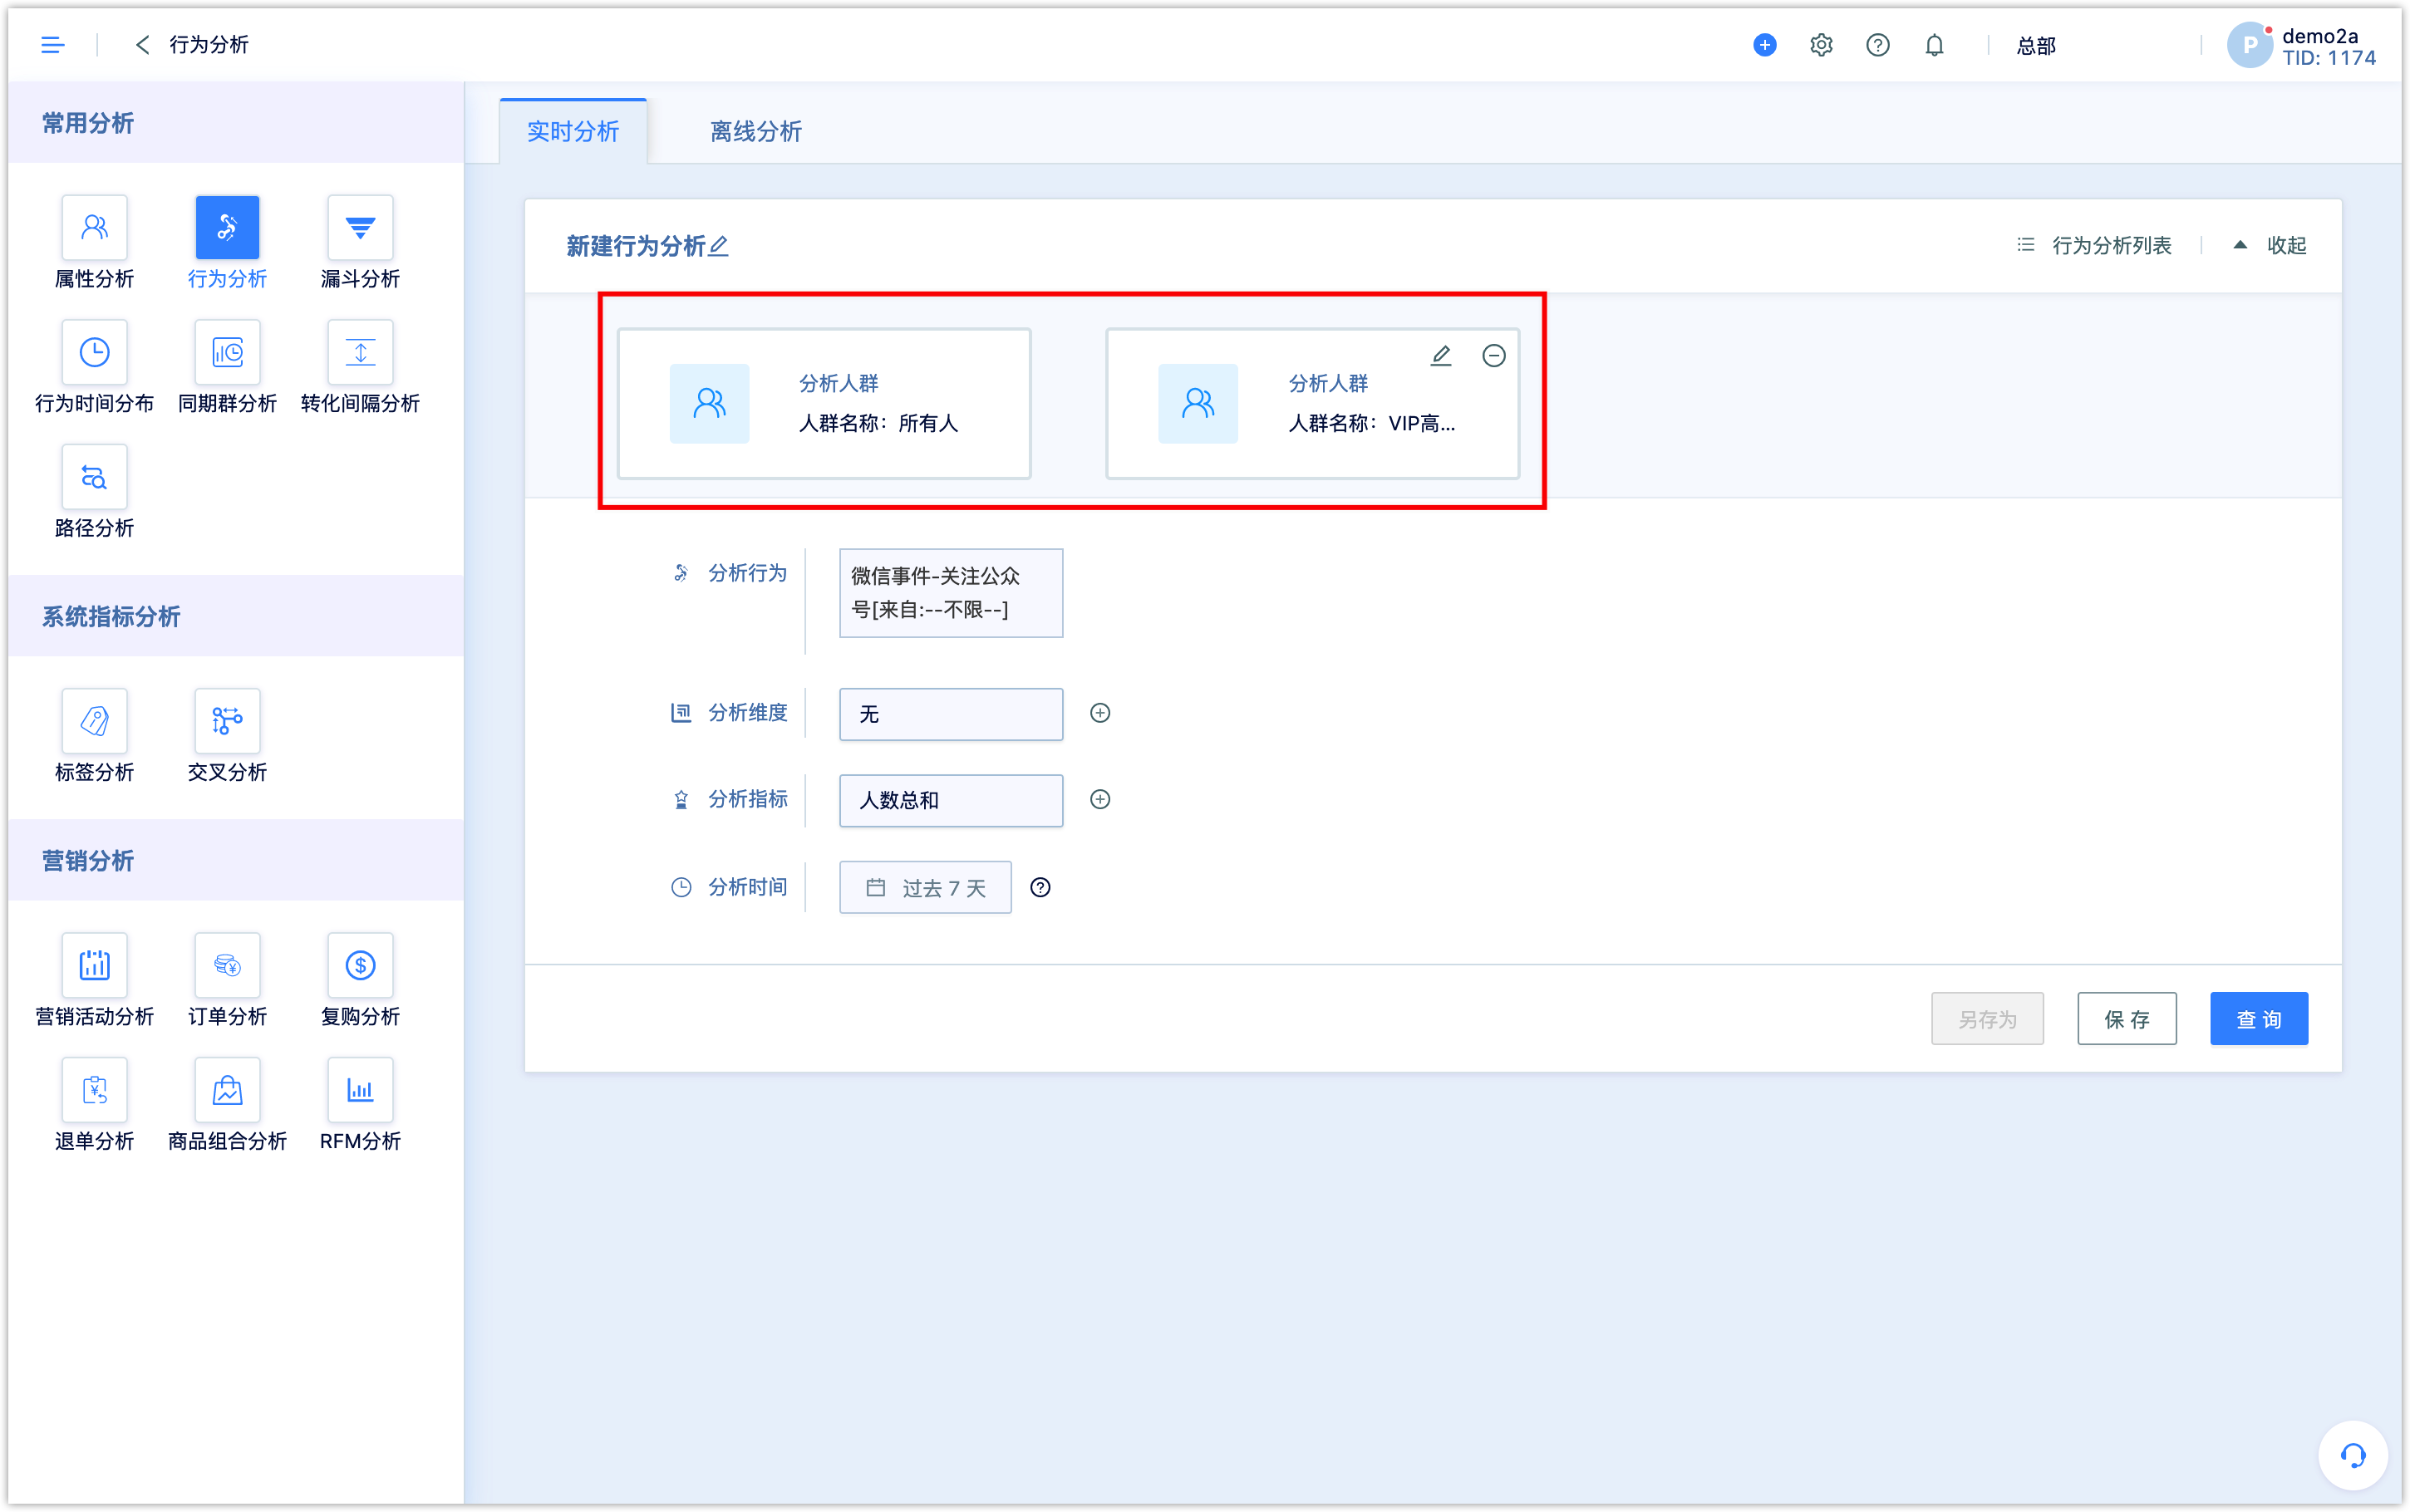
2.2Select analysis group
the analysis population is all customers by system default if it is not specified. If only one group of analysis is set, then multiple behaviors of the group can be compared and analyzed; if a comparison group is added, the same event of the two groups can be compared.
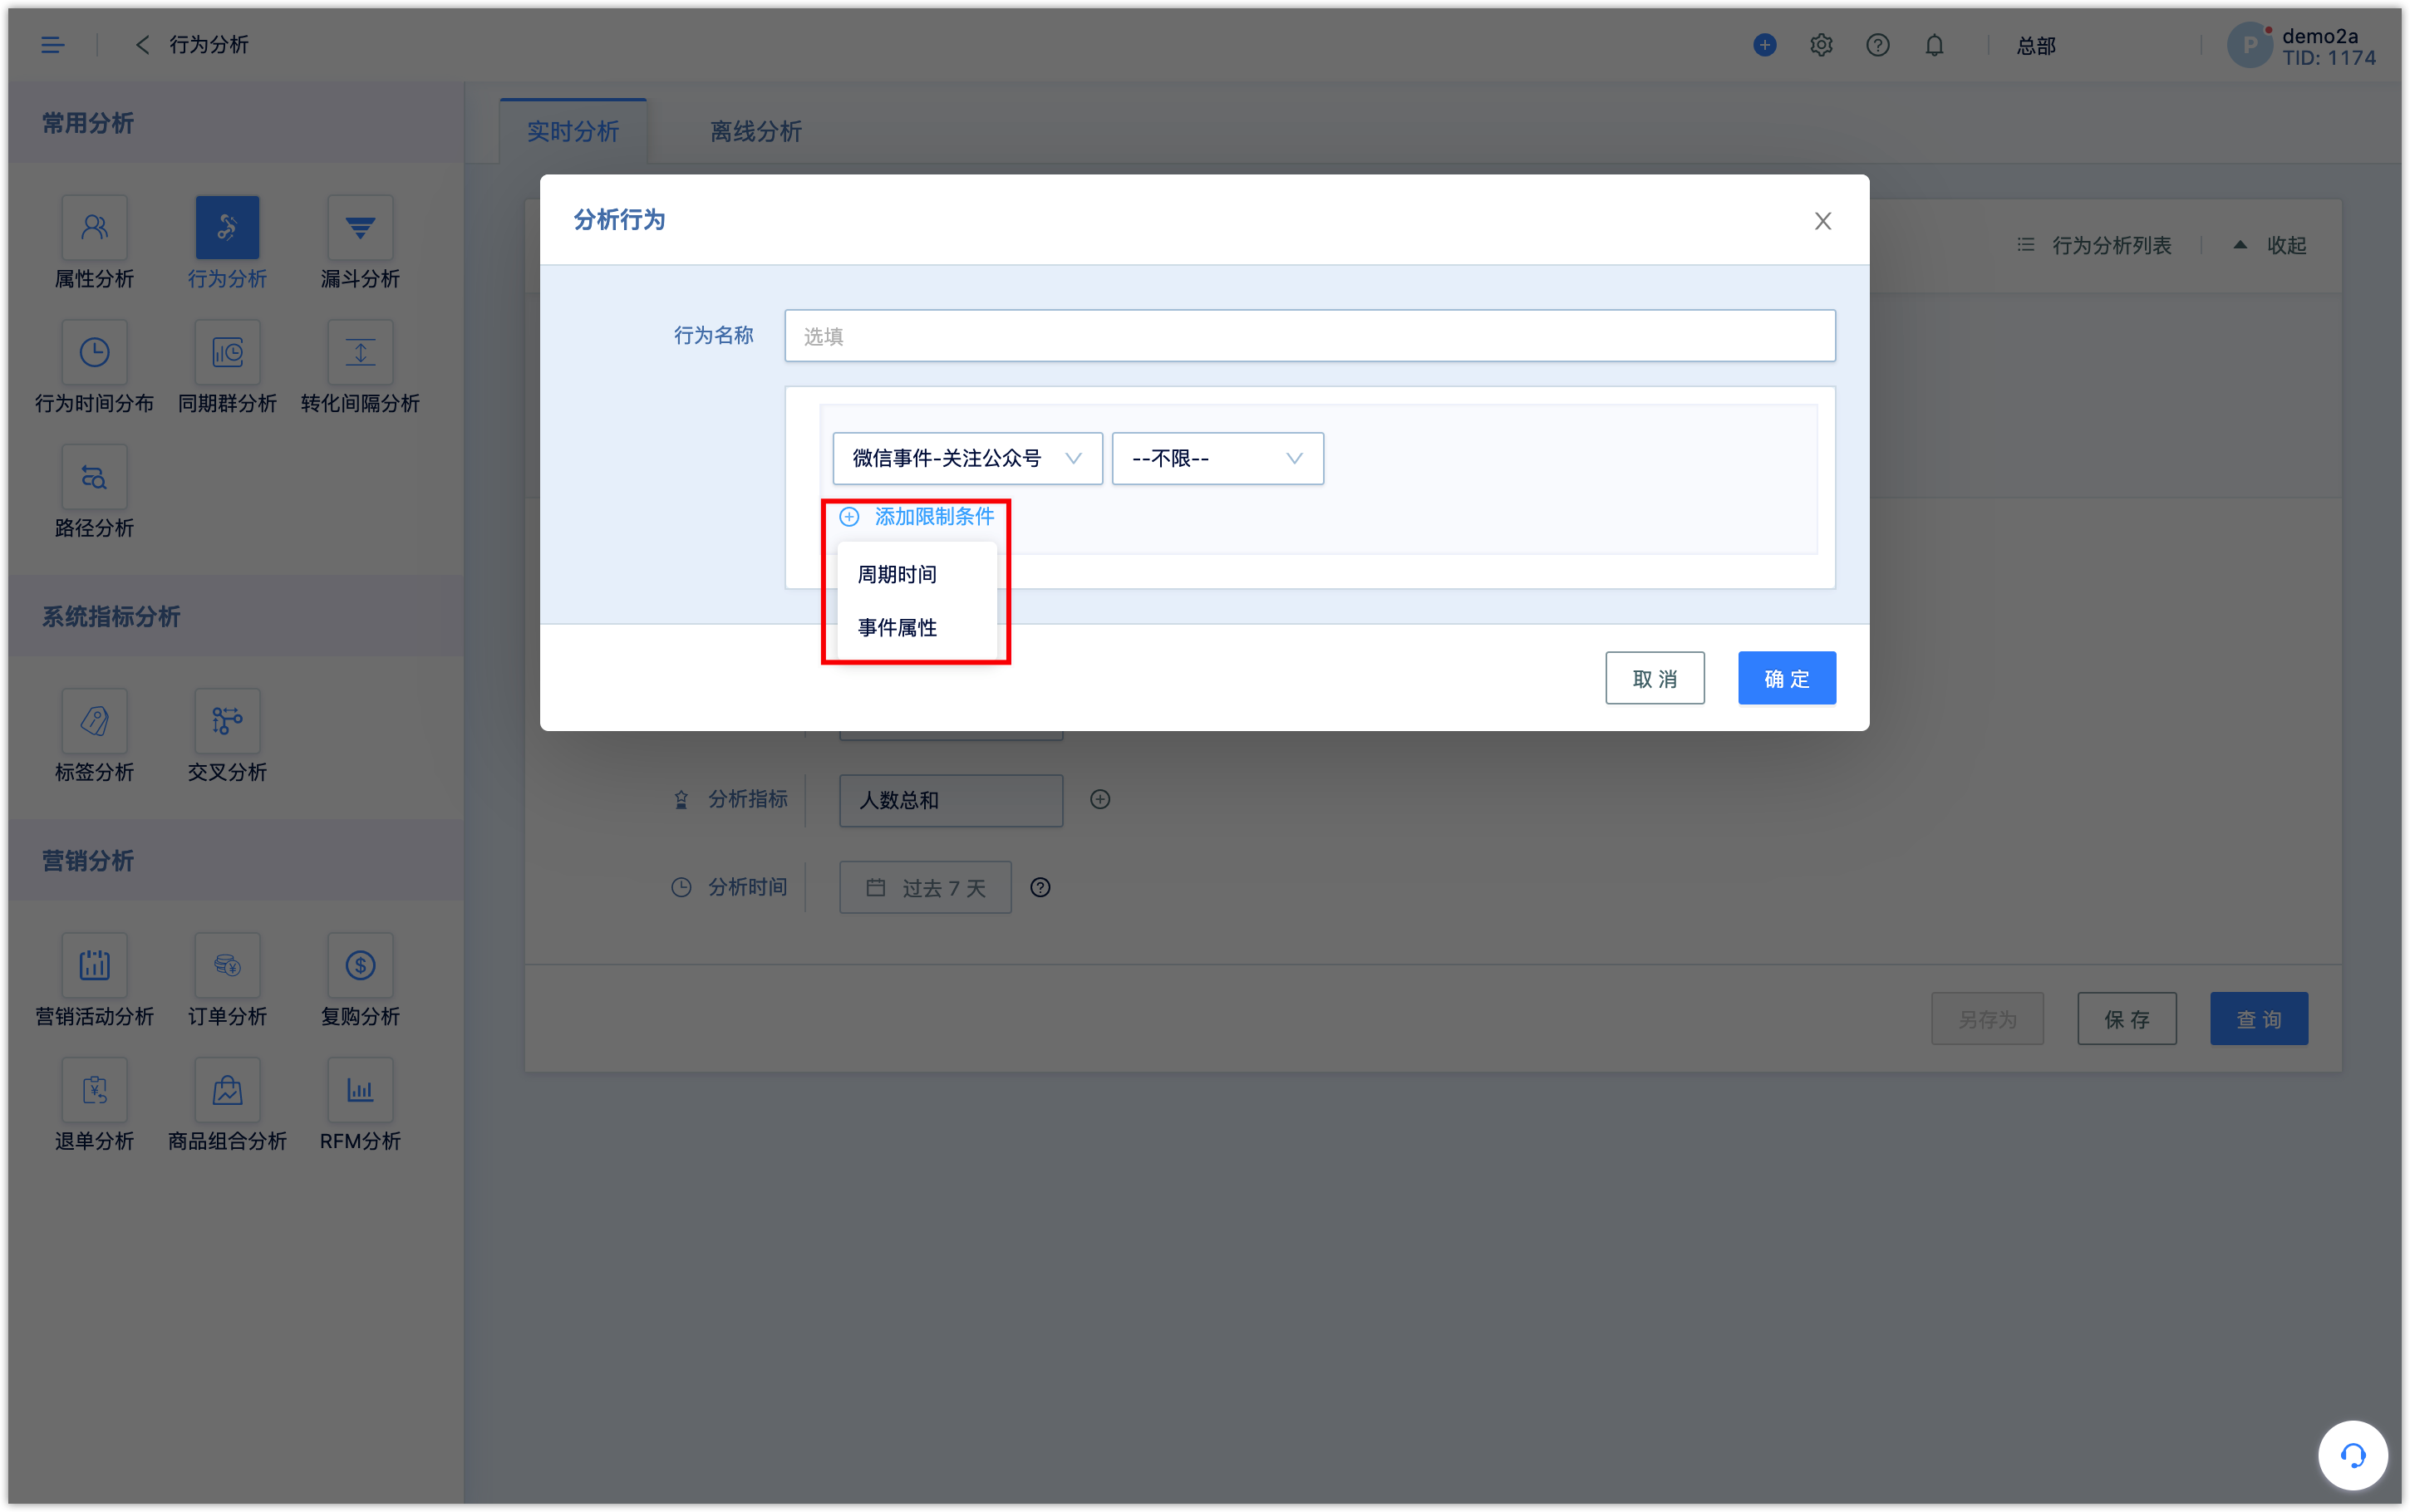
2.4Select analysis behavior
Select specific customer events for analysis. The selectable events include system default events and custom events, which can also be divided to proactively sent events and customer interaction events. When there is only one analysis group, the comparison behavior can be added. If there are two analysis groups, other events cannot be added.
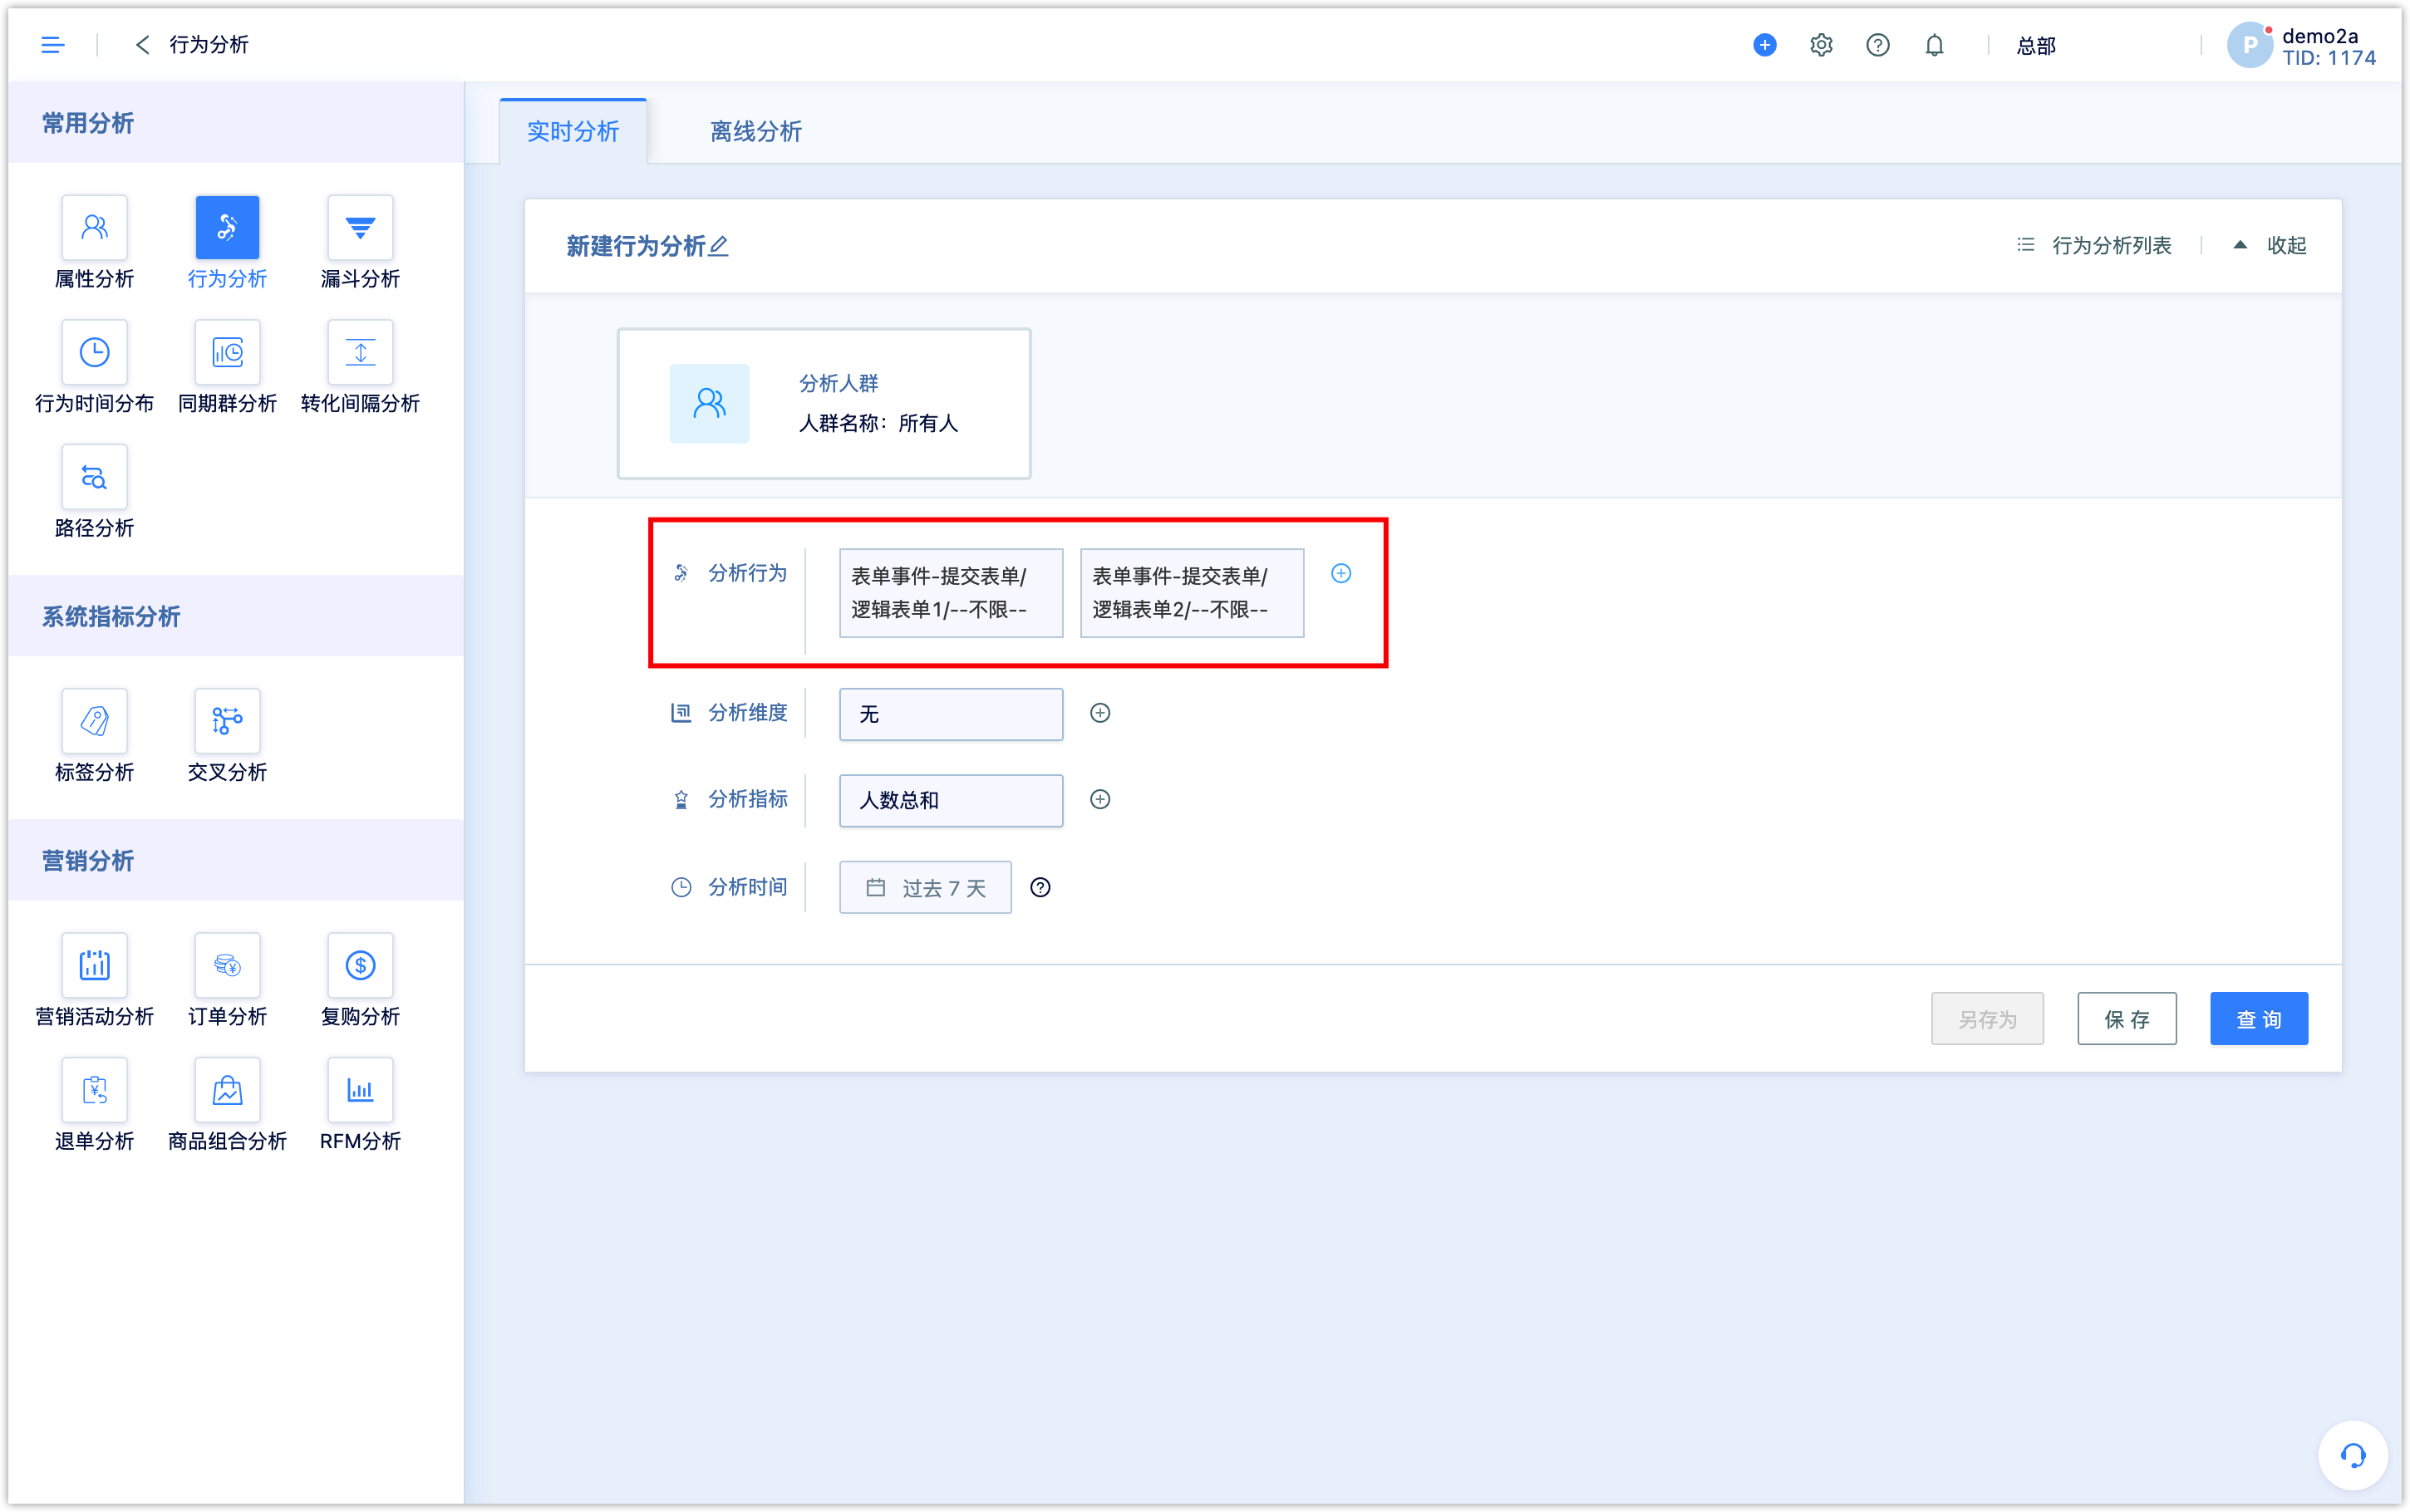
When selecting an event, you can add restrictions to this event.
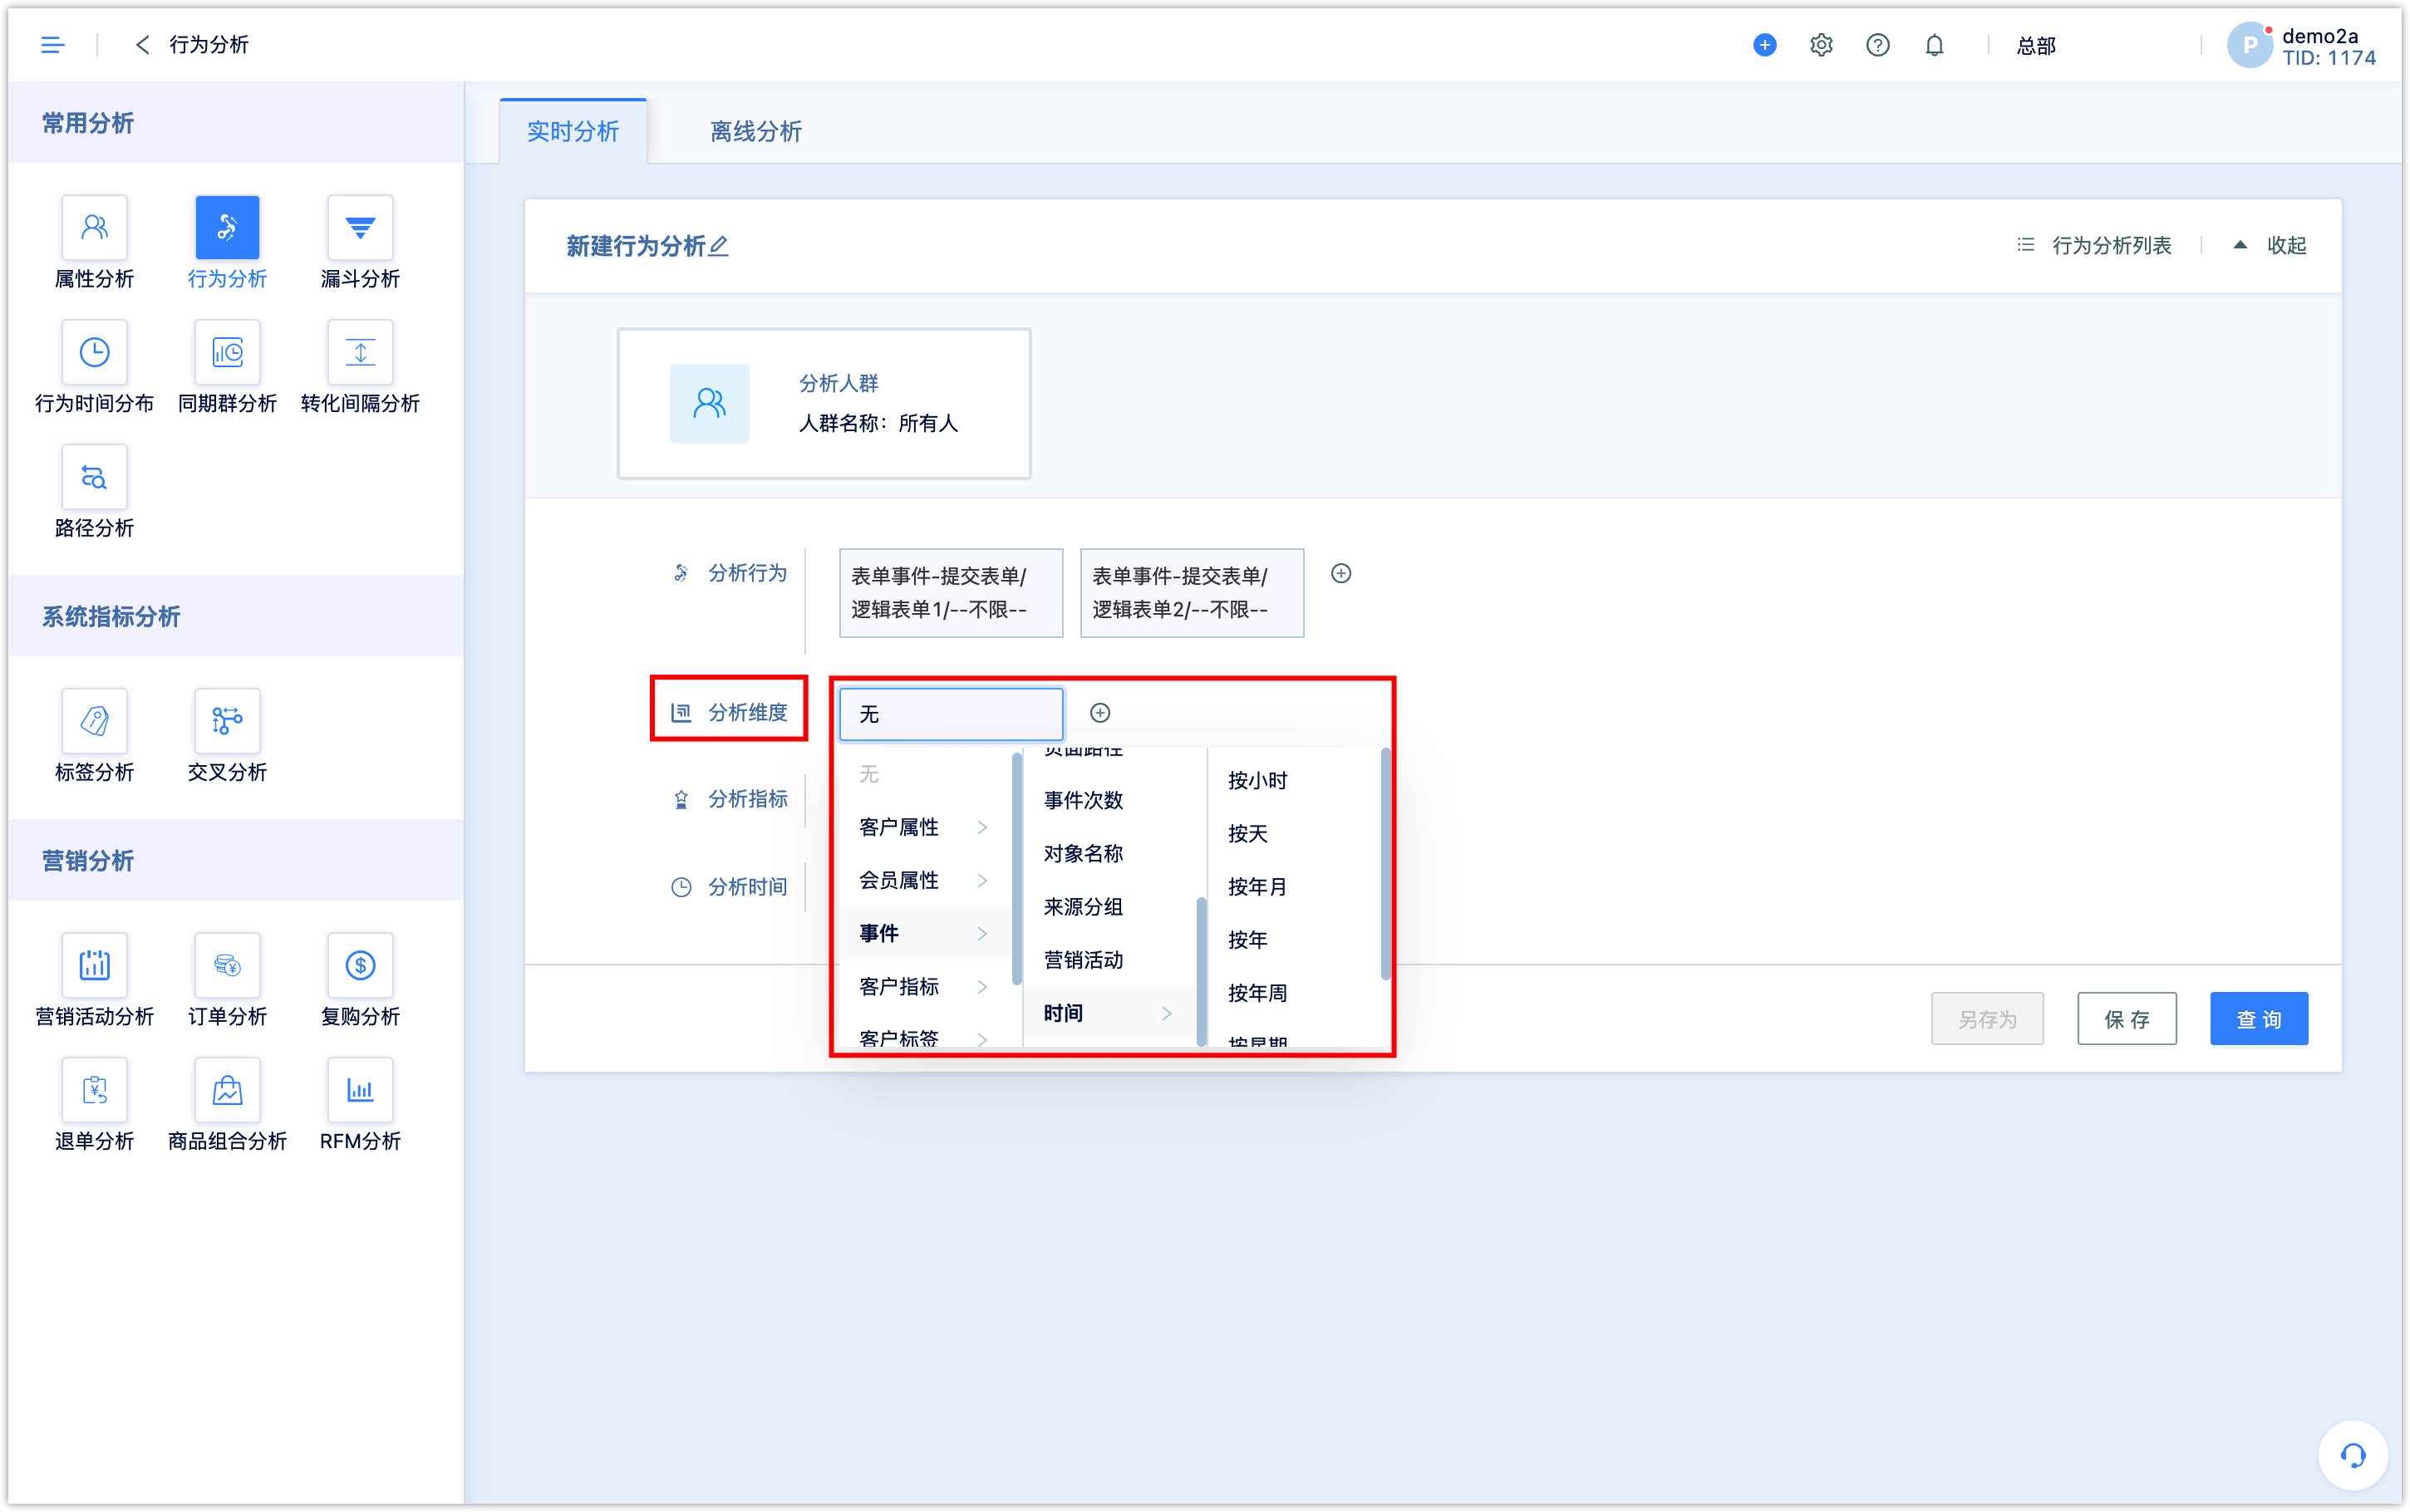
2.5Set analysis indexes and dimensions
Analysis dimensions can be customer attributes, customer indicators, etc., the most commonly used are event attributes in [Event], such as [Time], which is the time when the event occurs. You can choose to view the time trend of the event by day, year, month, etc.. Multi-dimensional analysis is supported, up to 4 dimensions can be added.
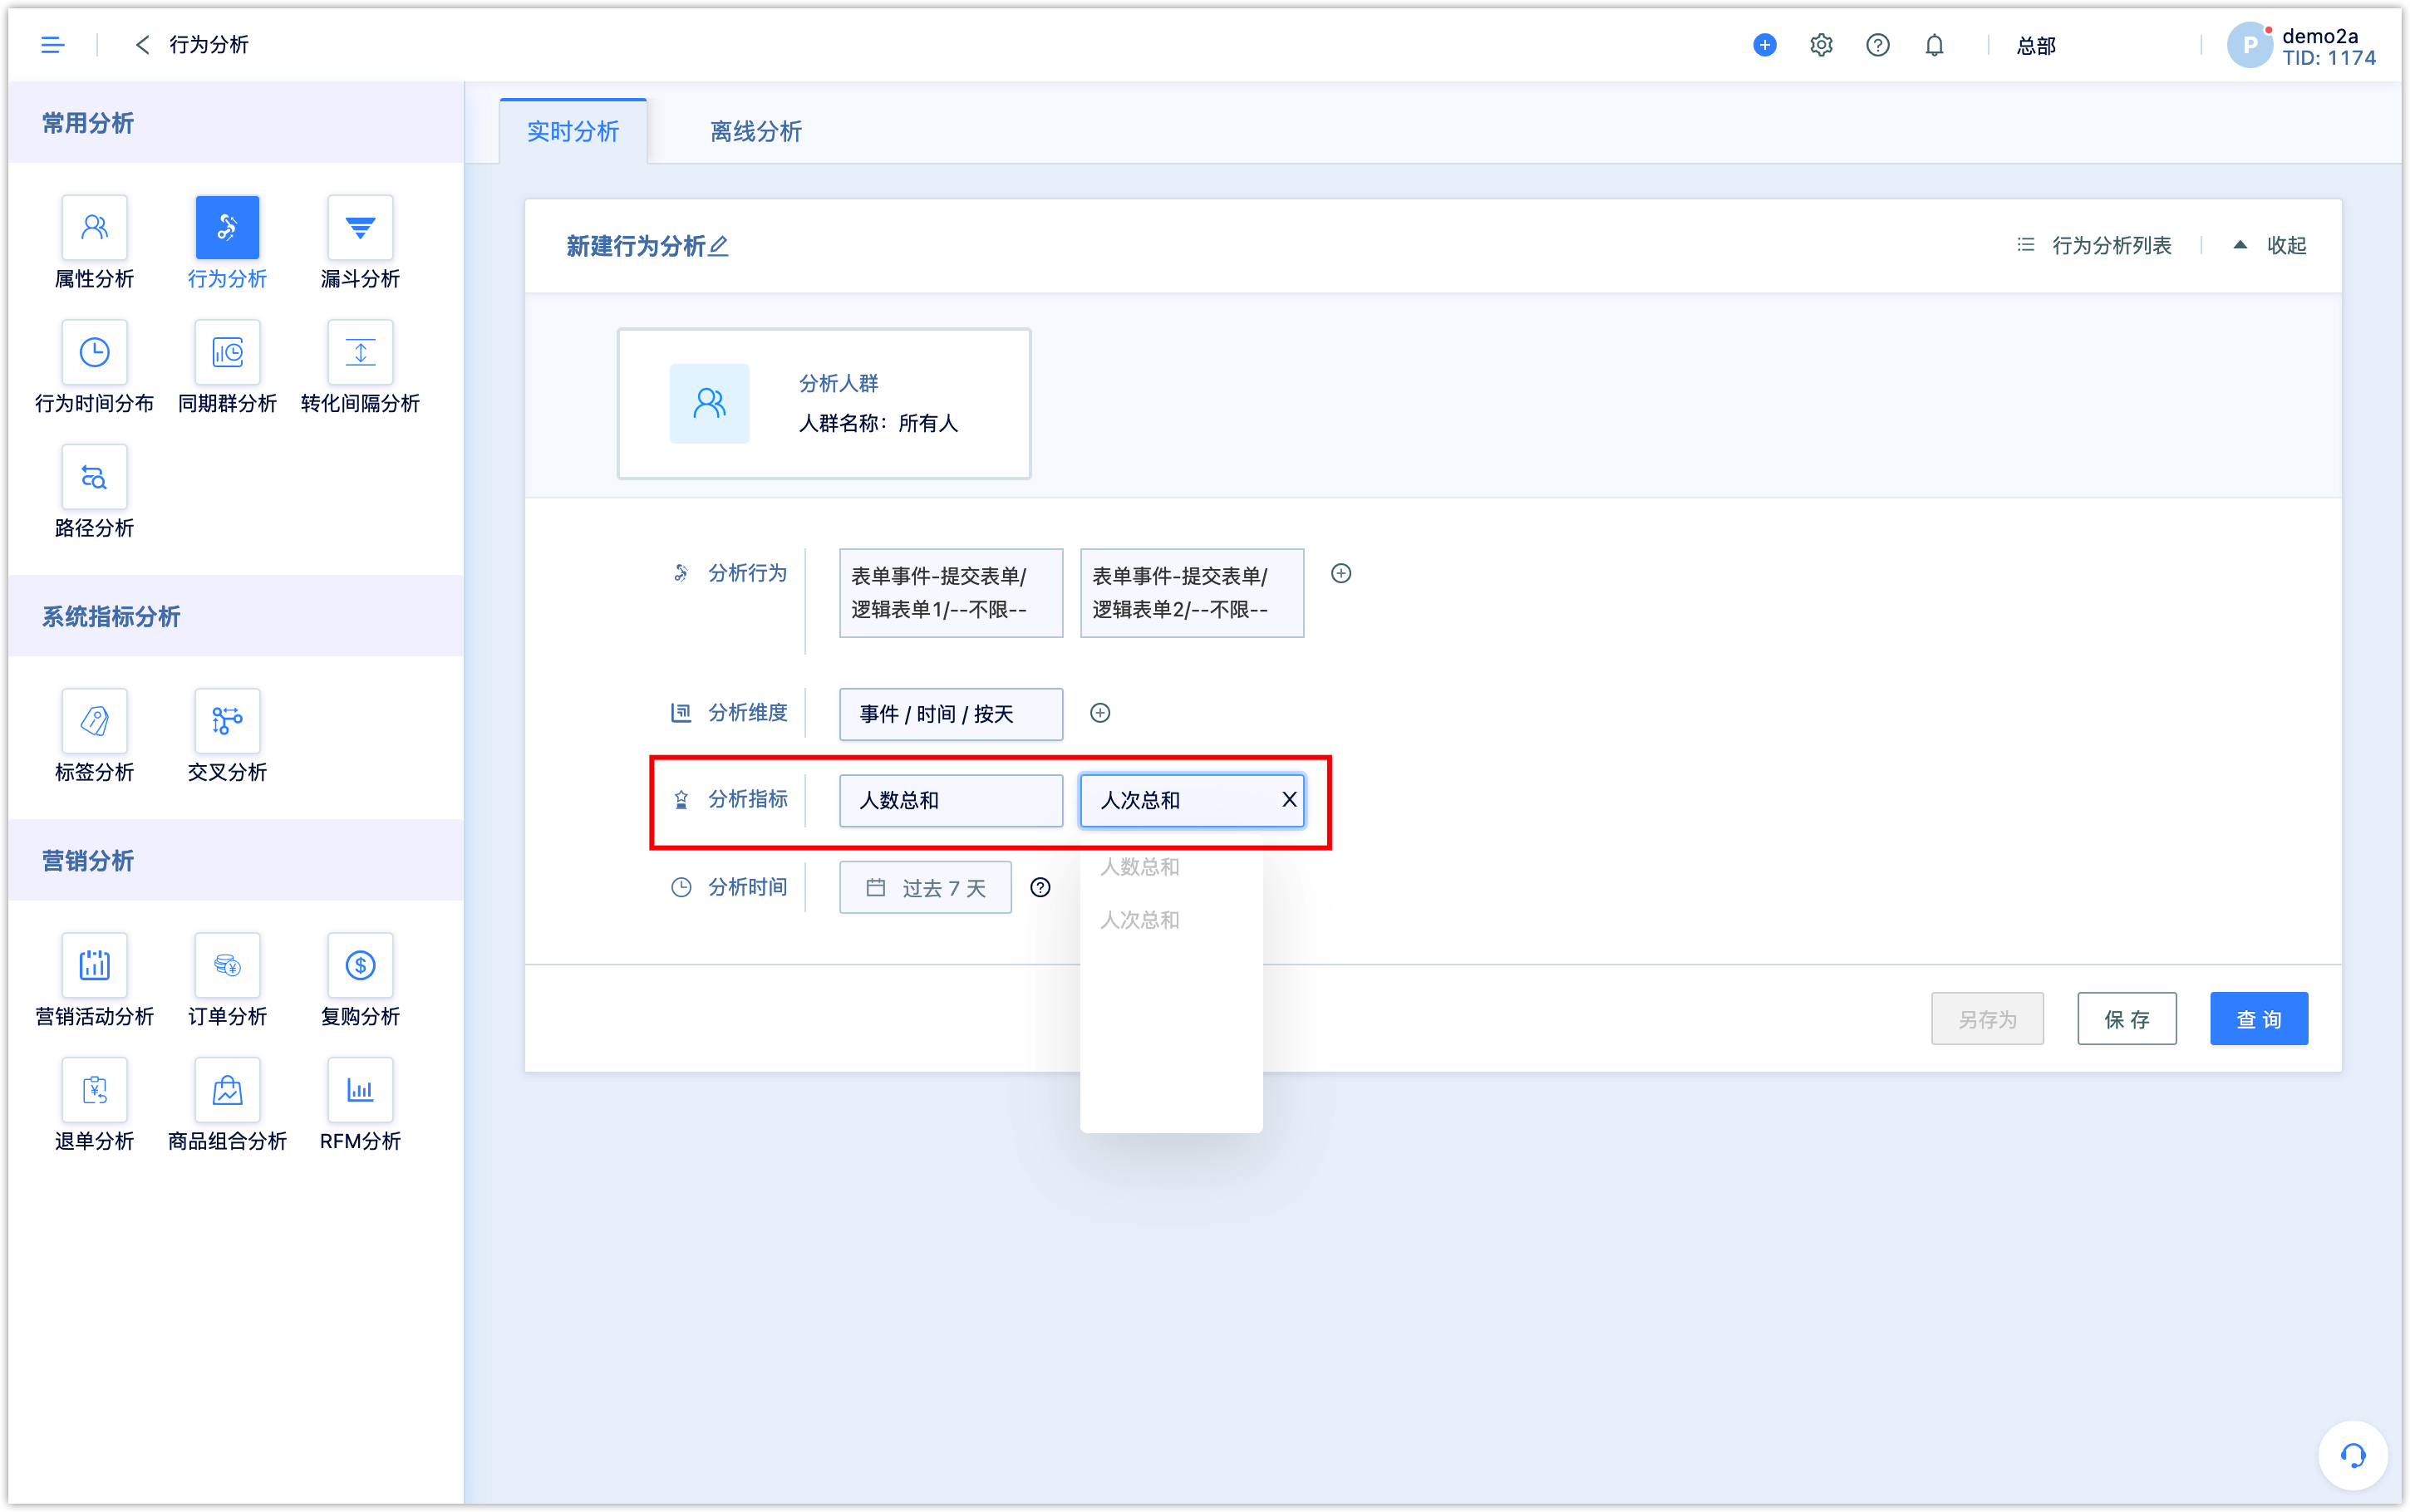
The analysis indexes are the total number of customers or the total times, that is, the number and frequency of events. Simultaneous analysis of the total number of people and total times is supported.
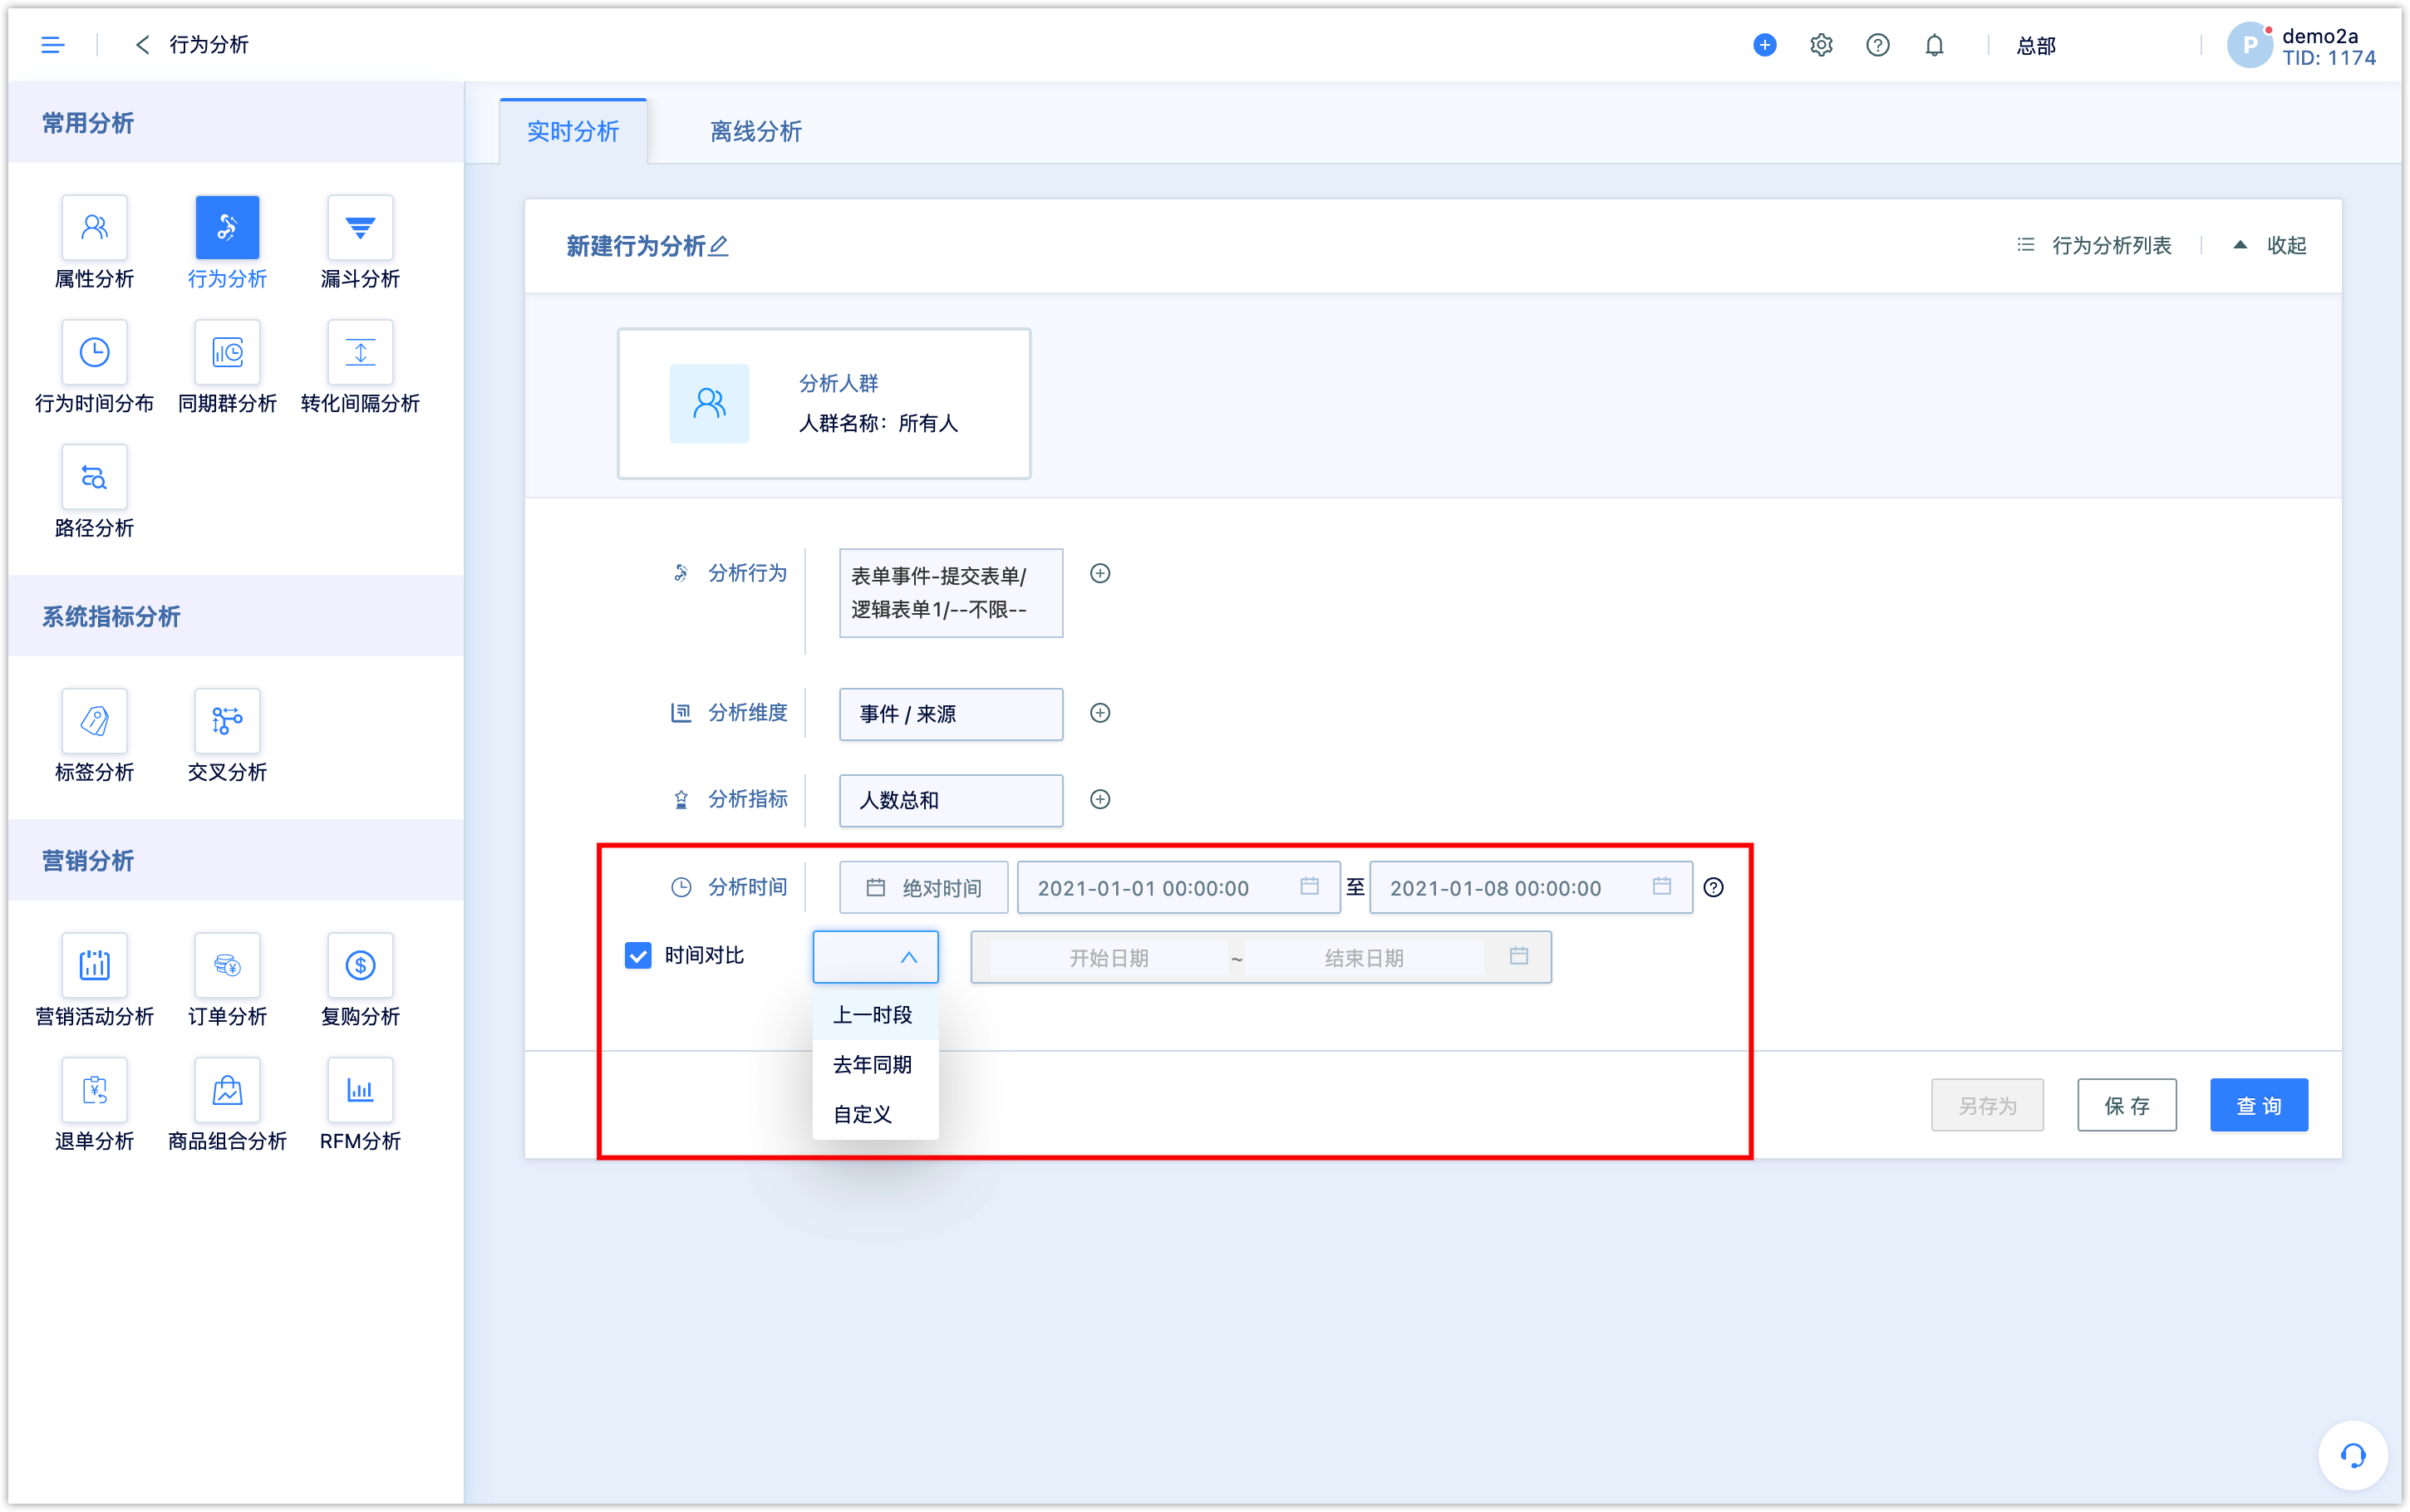
2.6Set analysis time
The analysis time is the time when the event occurs. DM Hub will analyze the events that occurred during this time period. When there is only one behavior to be analyzed, this behavior can be compared among different time periods.
3.Setting
When the analysis dimension is a time-type dimension, the outcome 0 can be hidden. Then, in the analysis result, the analysis dimension whose index number is 0 will not be displayed, which is convenient for continuous display of time chart.
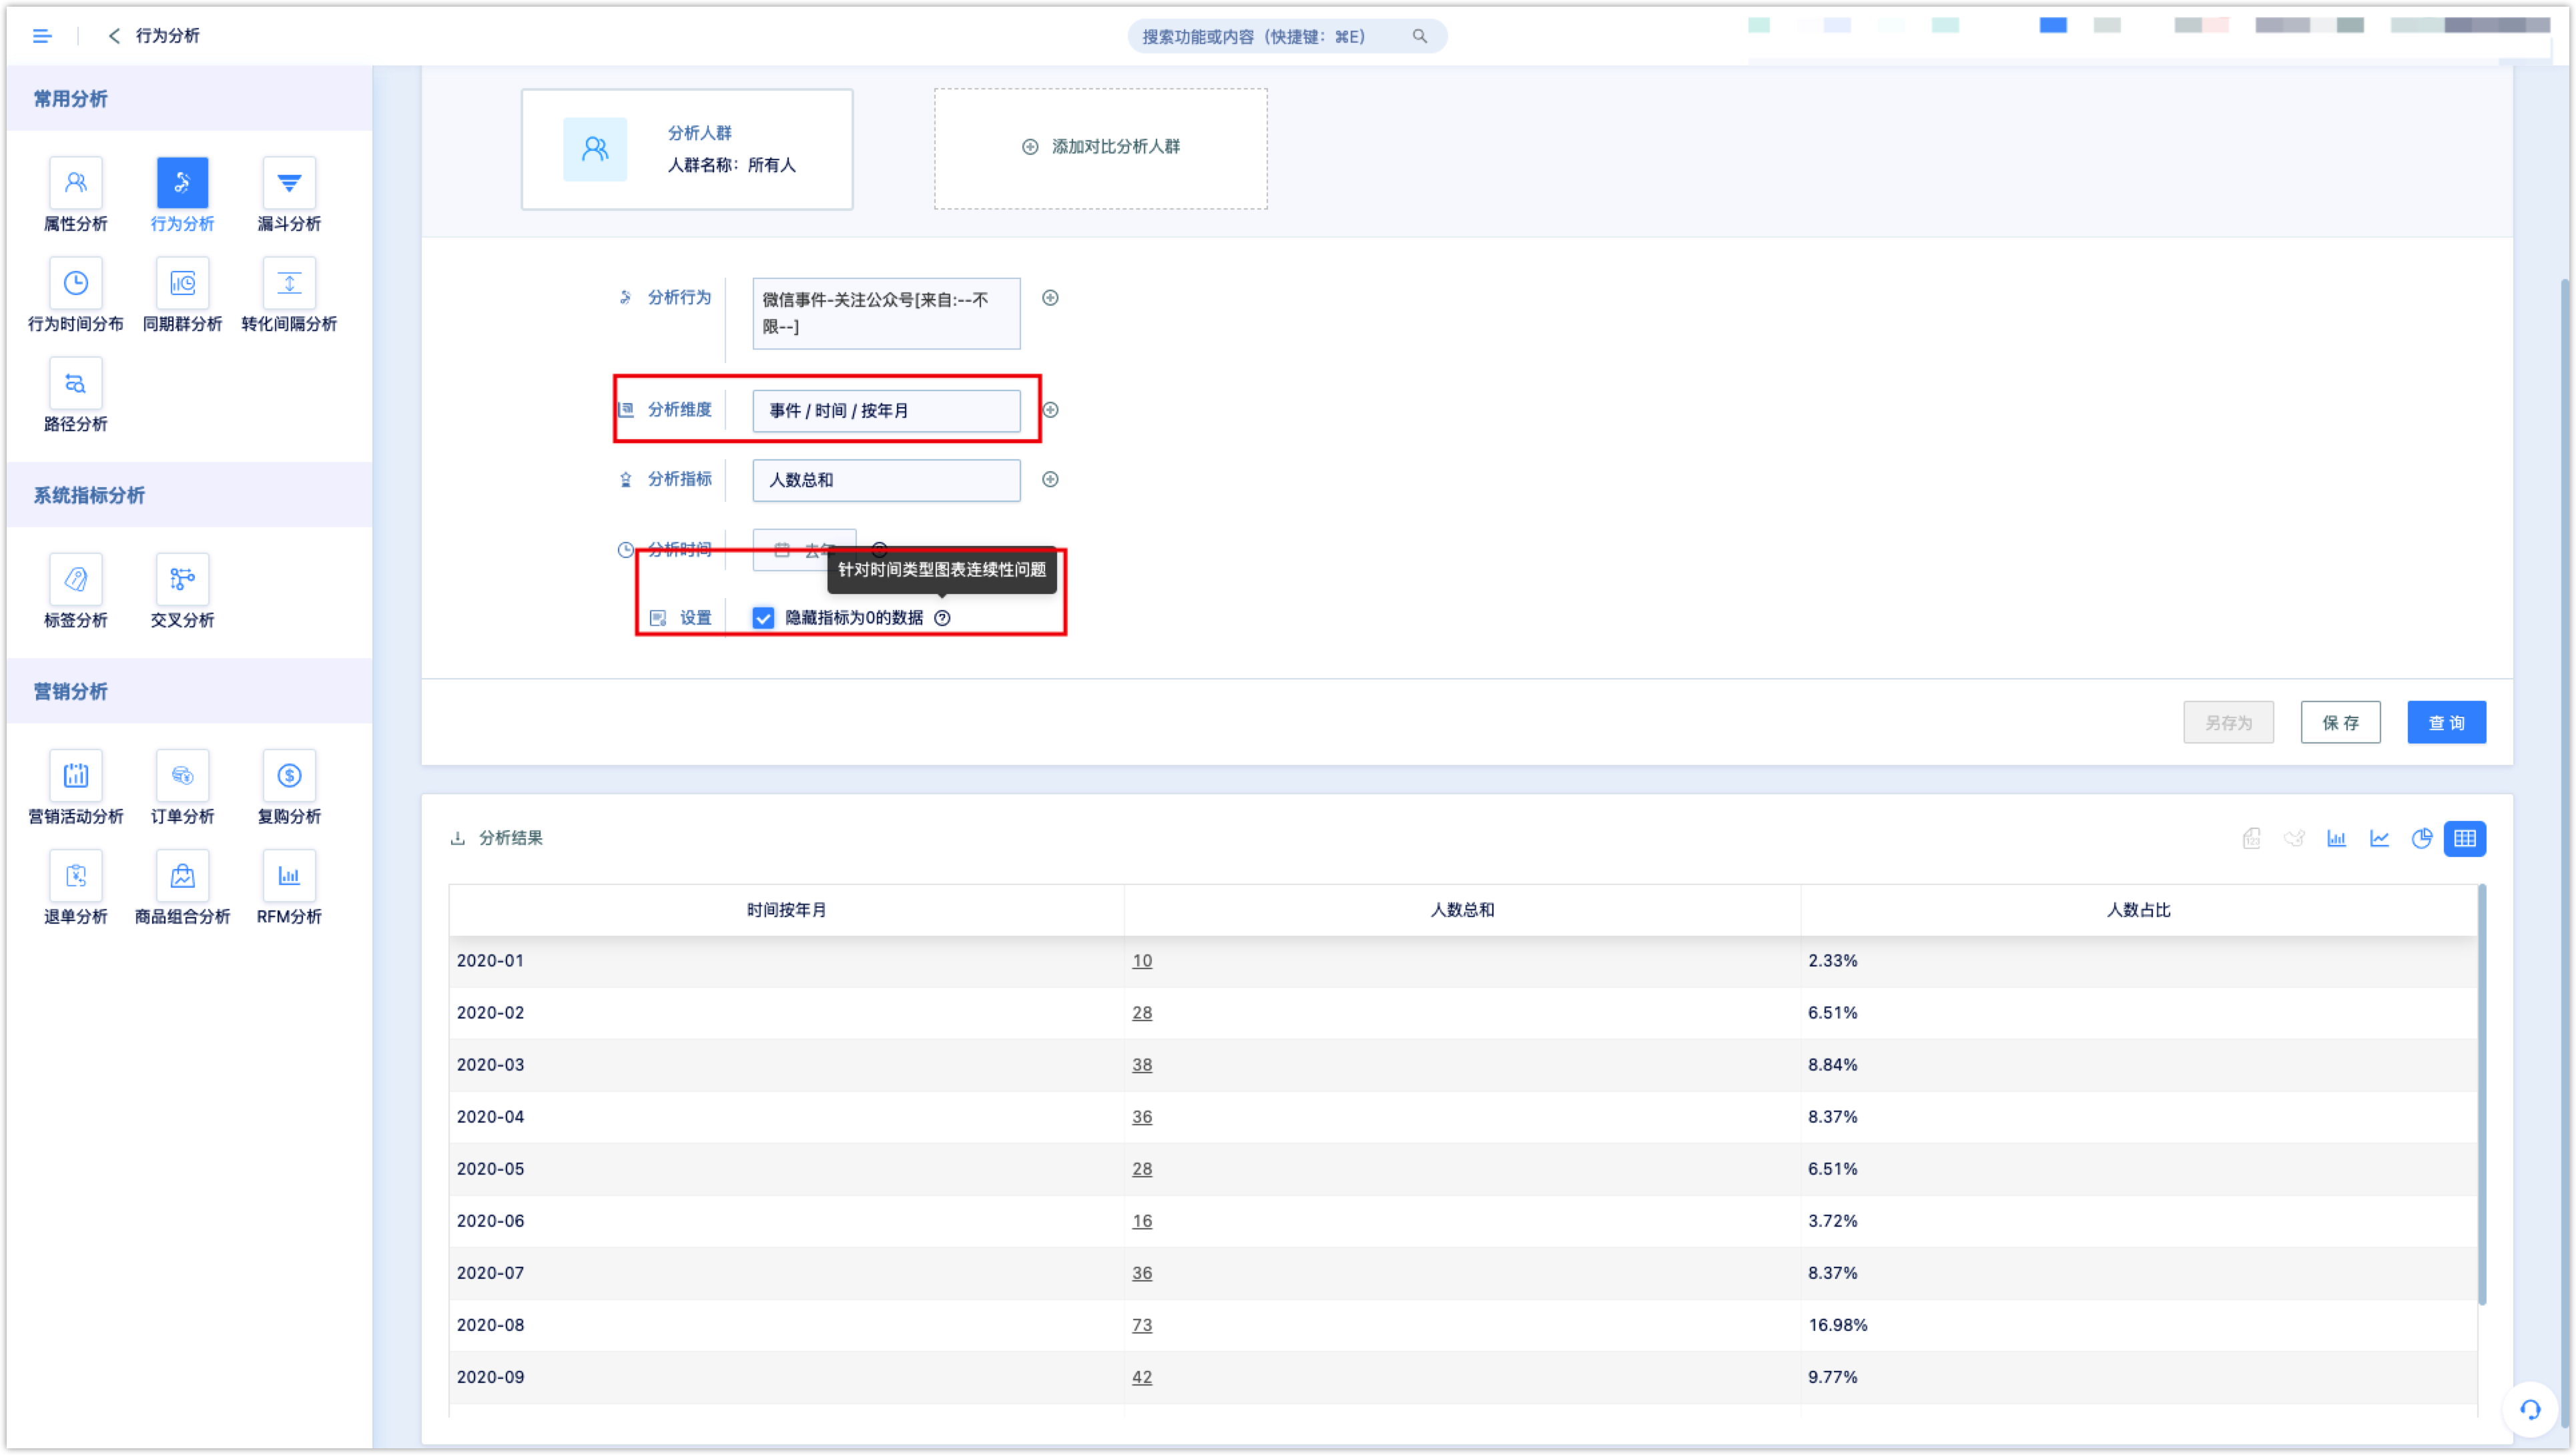
2.7Analysis results
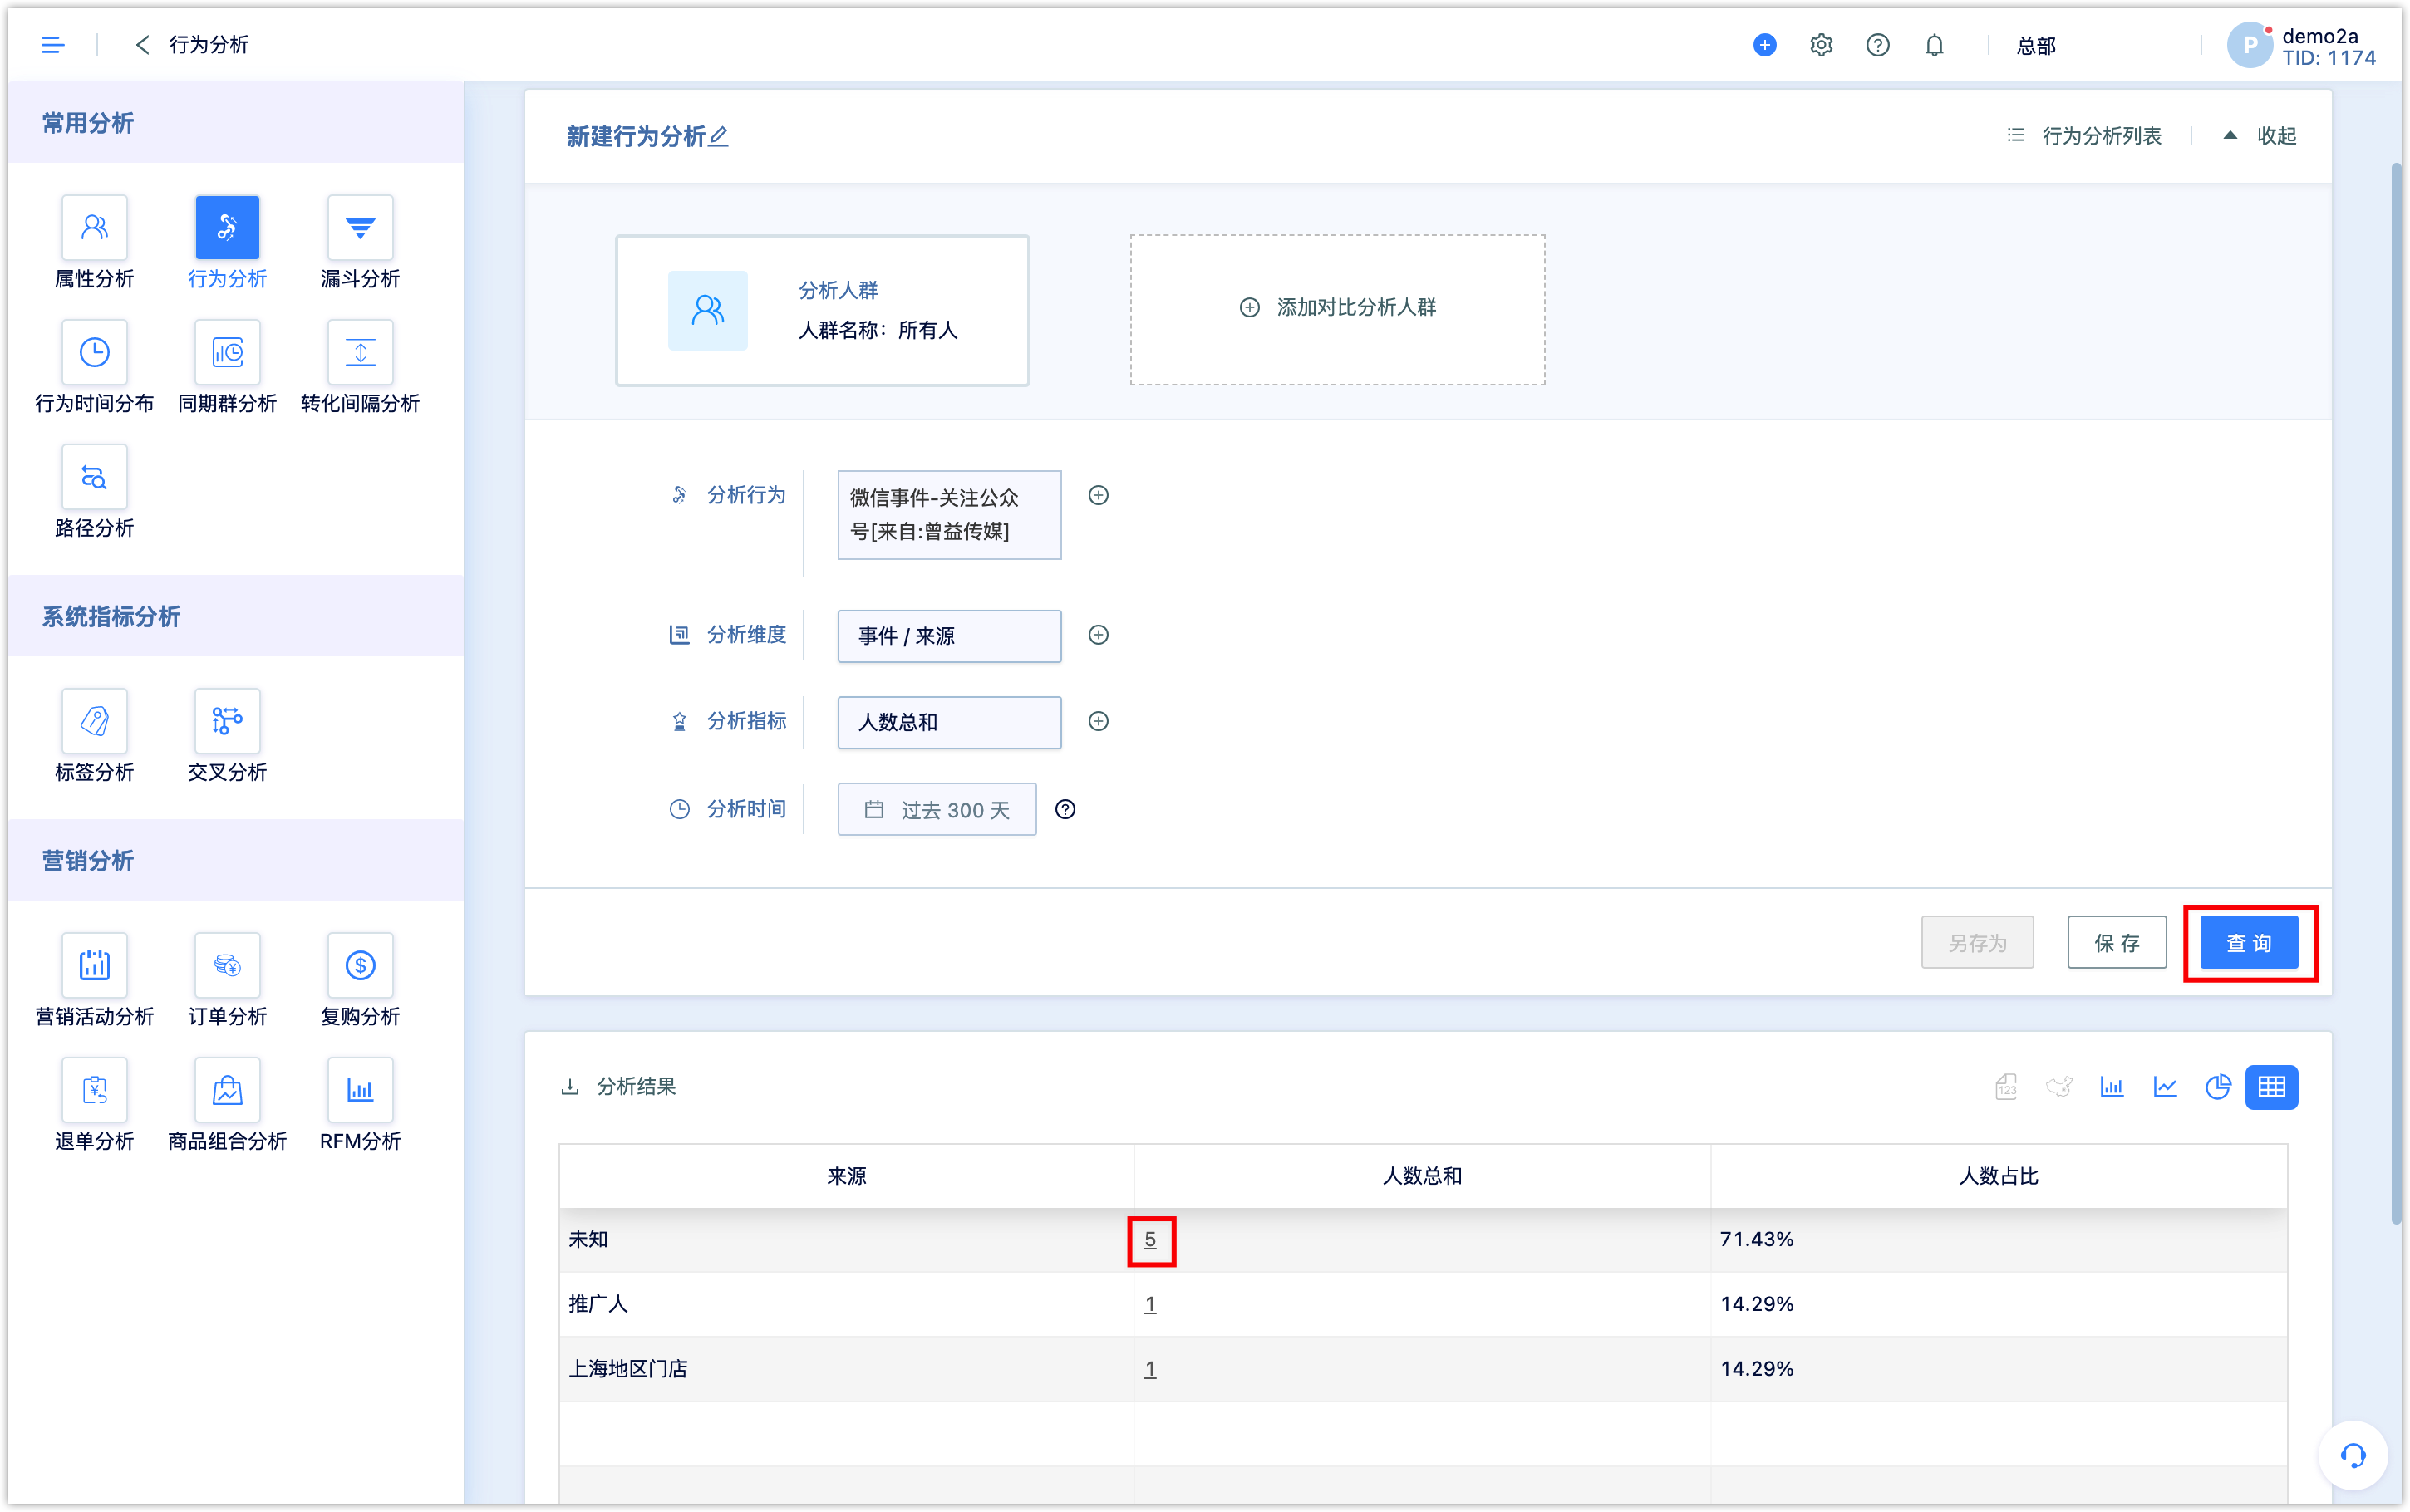
After the setting is completed, click [Query] to view the analysis results, and click on the specific numbers in the table to see specific customers.
Note: The number in the table contains anonymous customer data, that is, only analytical numbers display and no specific customers in the system. Therefore, when you click on the number to view specific customers, it may appear that the total number of specific customers is less than the number shown in the analysis.