Order analysis
1.Overview
DM DM Hub is capable of importing multiple order data, such as Tmall, official mall, etc. Order analysis can perform detailed analysis on the amount of the order, the number of purchases, the number of orders, and per customer transaction (ATV). It gives true and direct feedback on what impact a series of marketing methods have on the final sales data, thus completing a closed loop.
2.The difference between real-time analysis and offline analysis
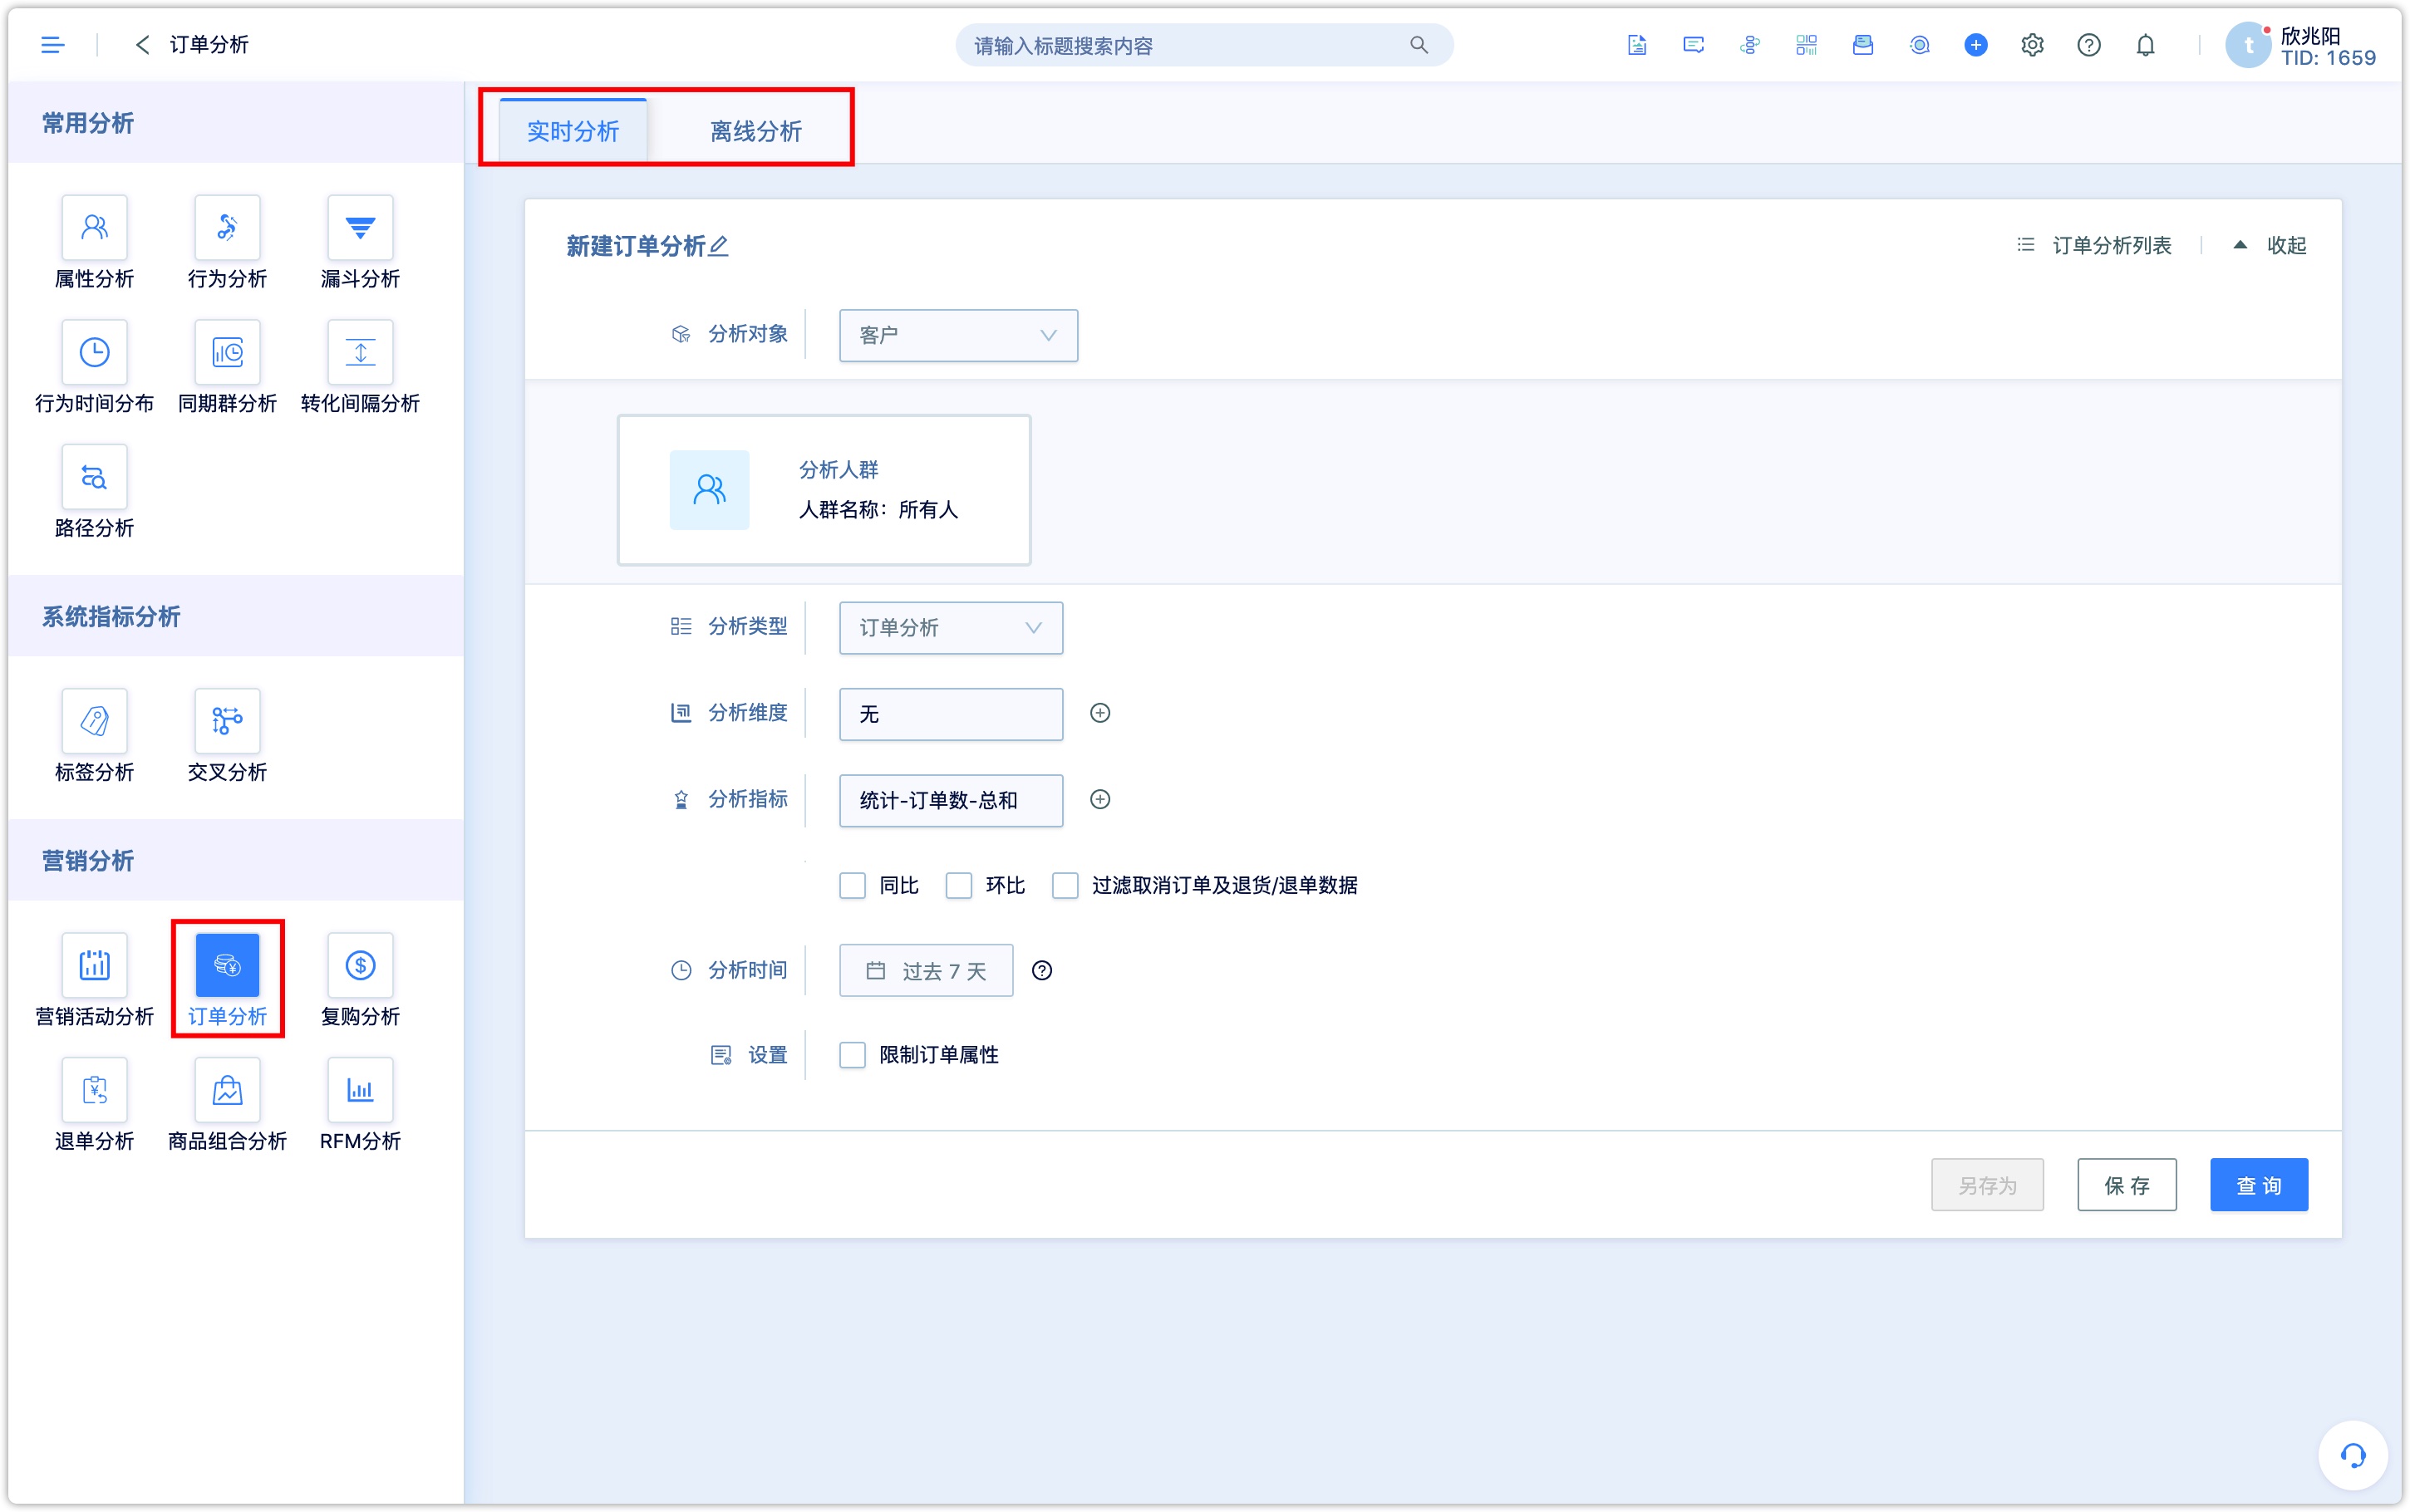
In addition to the slight difference in calculation logic of query data, real-time analysis and offline analysis are completely the same,in terms of condition settings, data reading and query scope, and analysis results.
Real-time analysis: after setting the conditions, the analysis results will be calculated in real time when you click on the query. The system itself has a real-time query rule, that is, if the final result is not calculated in one minute, the front end will always show that the calculation is loading. If the amount of order data is very large, then real-time query is not the most convenient way for marketing analysts. On the contrast, offline analysis is officially aimed at processing the huge amount of data. After an offline analysis is created or a saved analysis is recalculated, the system starts to calculate until the result is calculated.
Let’s take real-time marketing as an example to introduce the use of order analysis in detail.
3.real time analysis
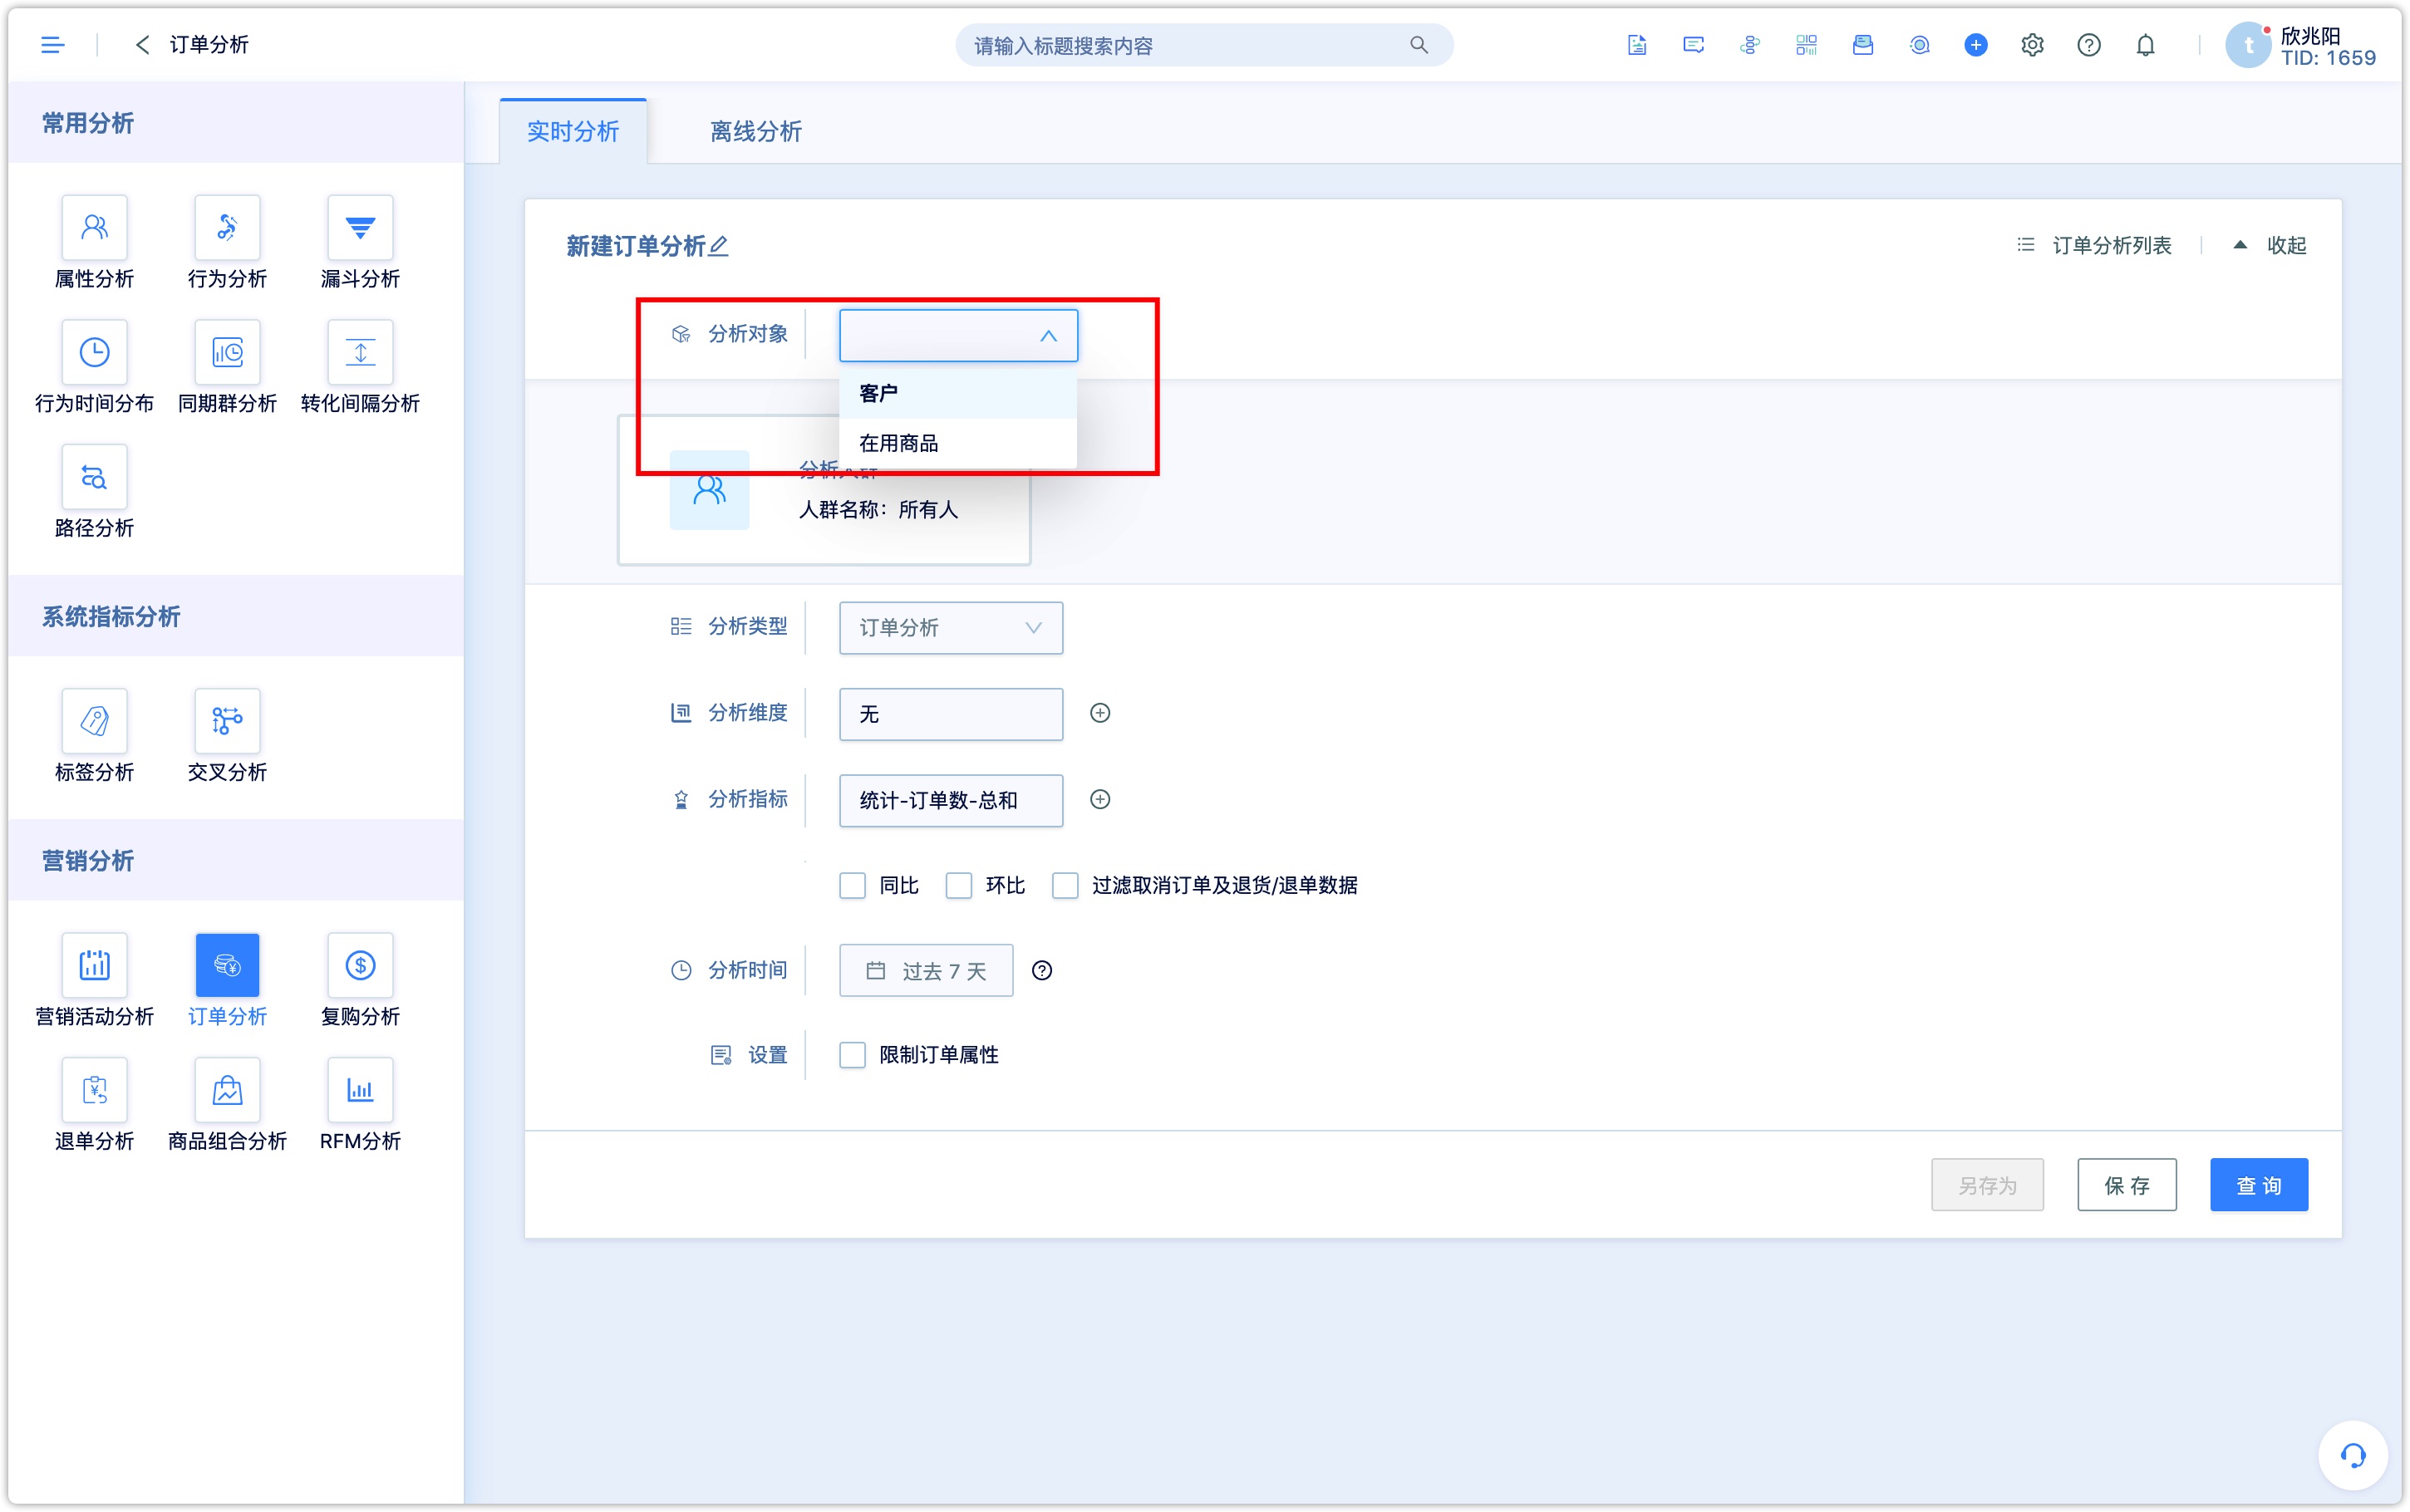
3.1Set analysis object
The analysis objects of order analysis include "customers" and "goods in use". Goods in use are goods or services associated with customers. For specific instructions and use of goods in use, please refer to the "Introduction to Goods in Use" (link to be provided). If the object is the customer, that is, it would be the customer-related order data. If the object is the goods in use, that is, the order data would the goods in use.
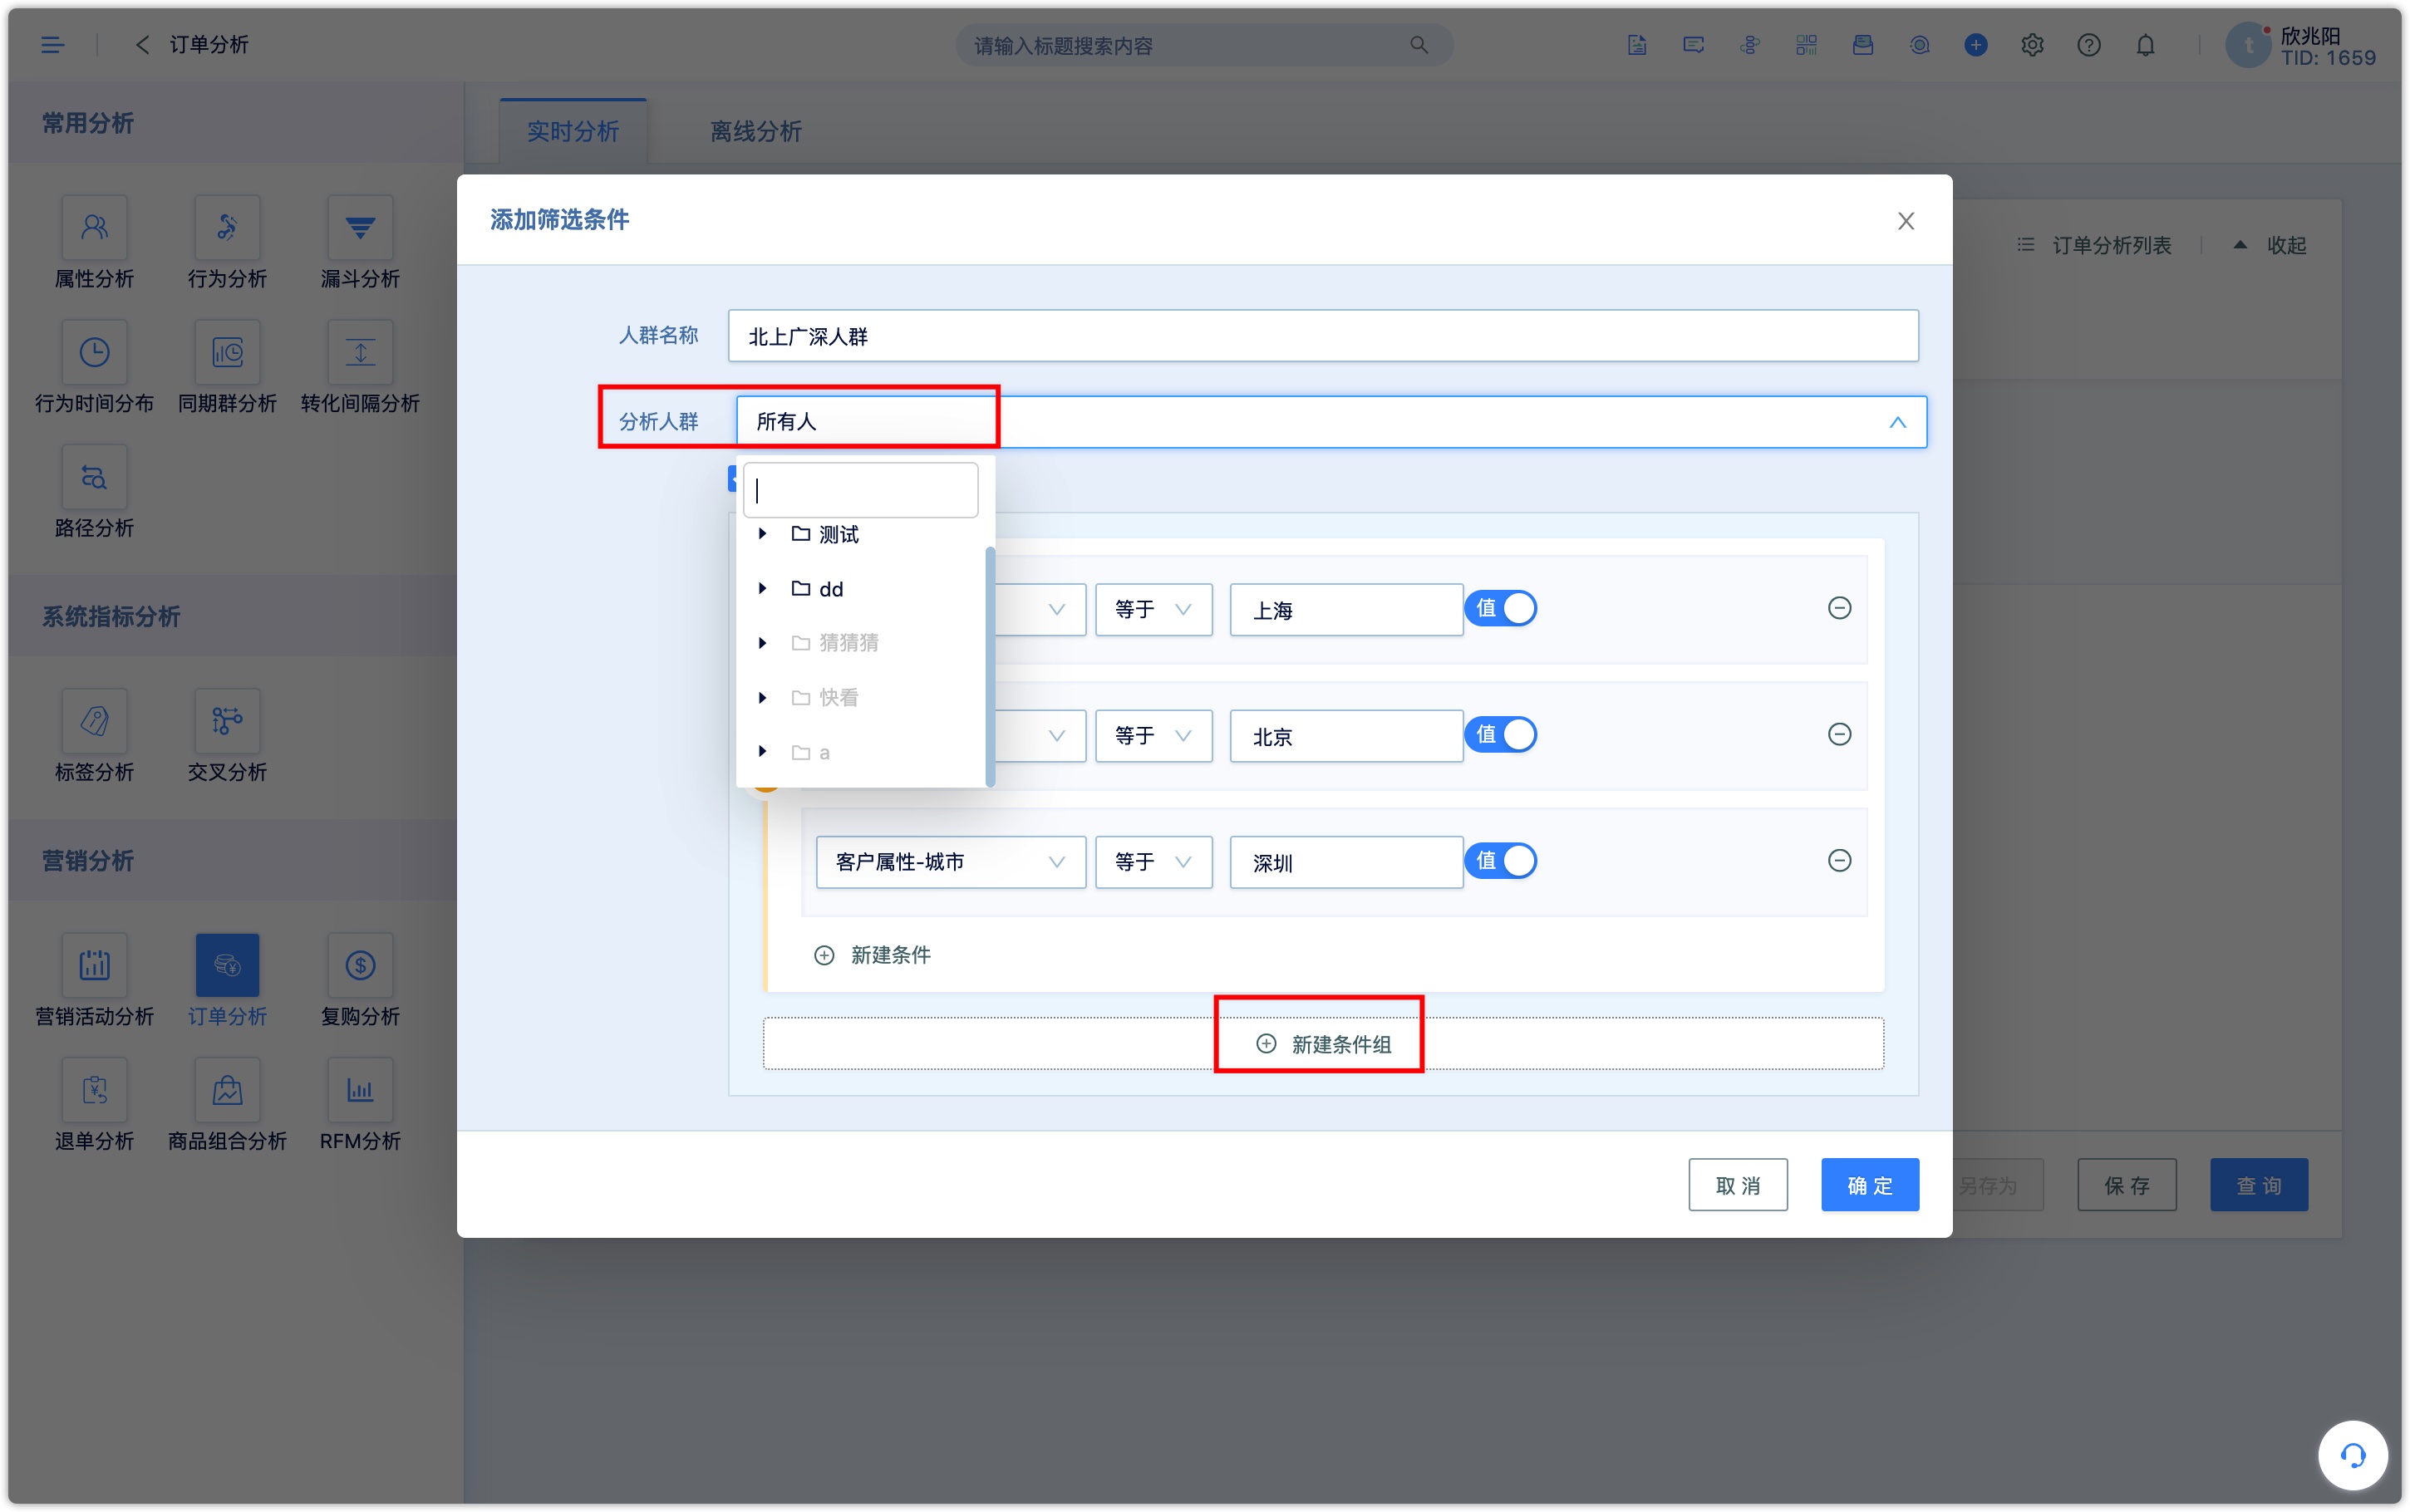
When the analysis is corresponded to customers, the analysis group can be restricted by selecting the customer group, adding customer attributes, member attributes, customer indexes, extended attributes, customer events, customer identity and other filter conditions.
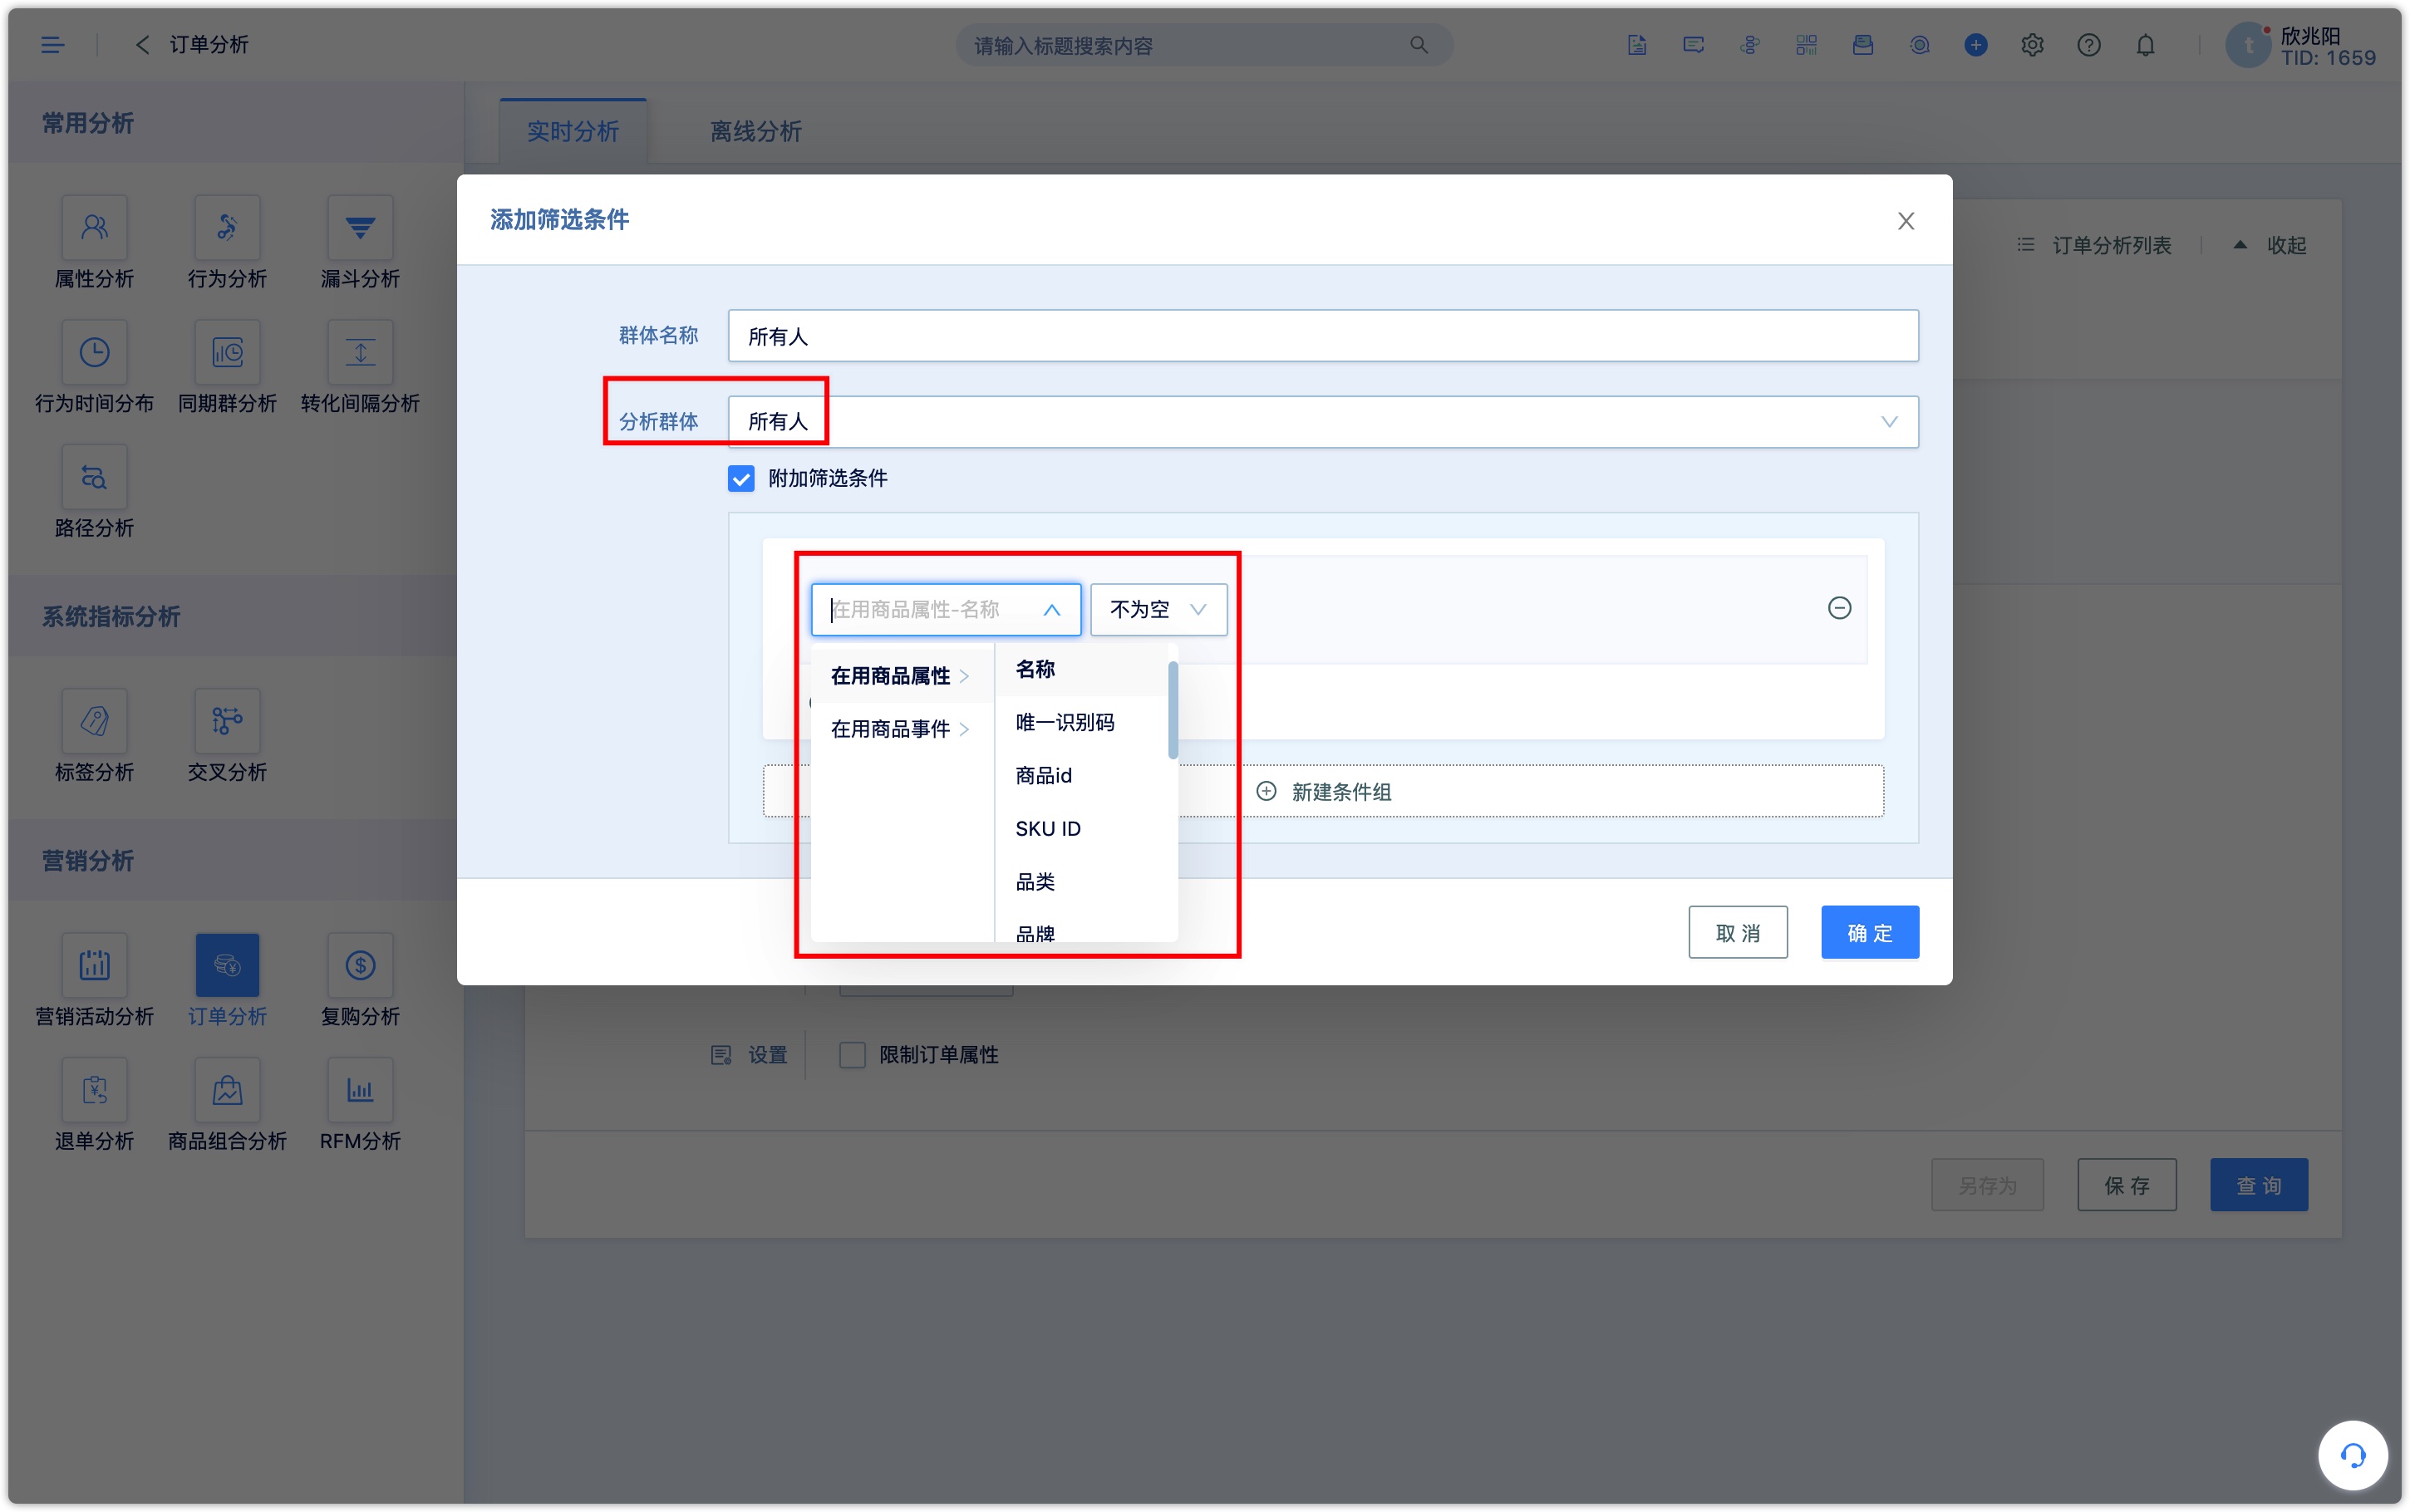
When the analysis object is goods in use, the analysis group can be restricted by selecting the goods’ group, adding the goods’ attribute, and combining the filter conditions of events related to goods in use.
3.2Select analysis type
The analysis types of order analysis include "order analysis", "first purchase analysis", and "non-first purchase analysis"..
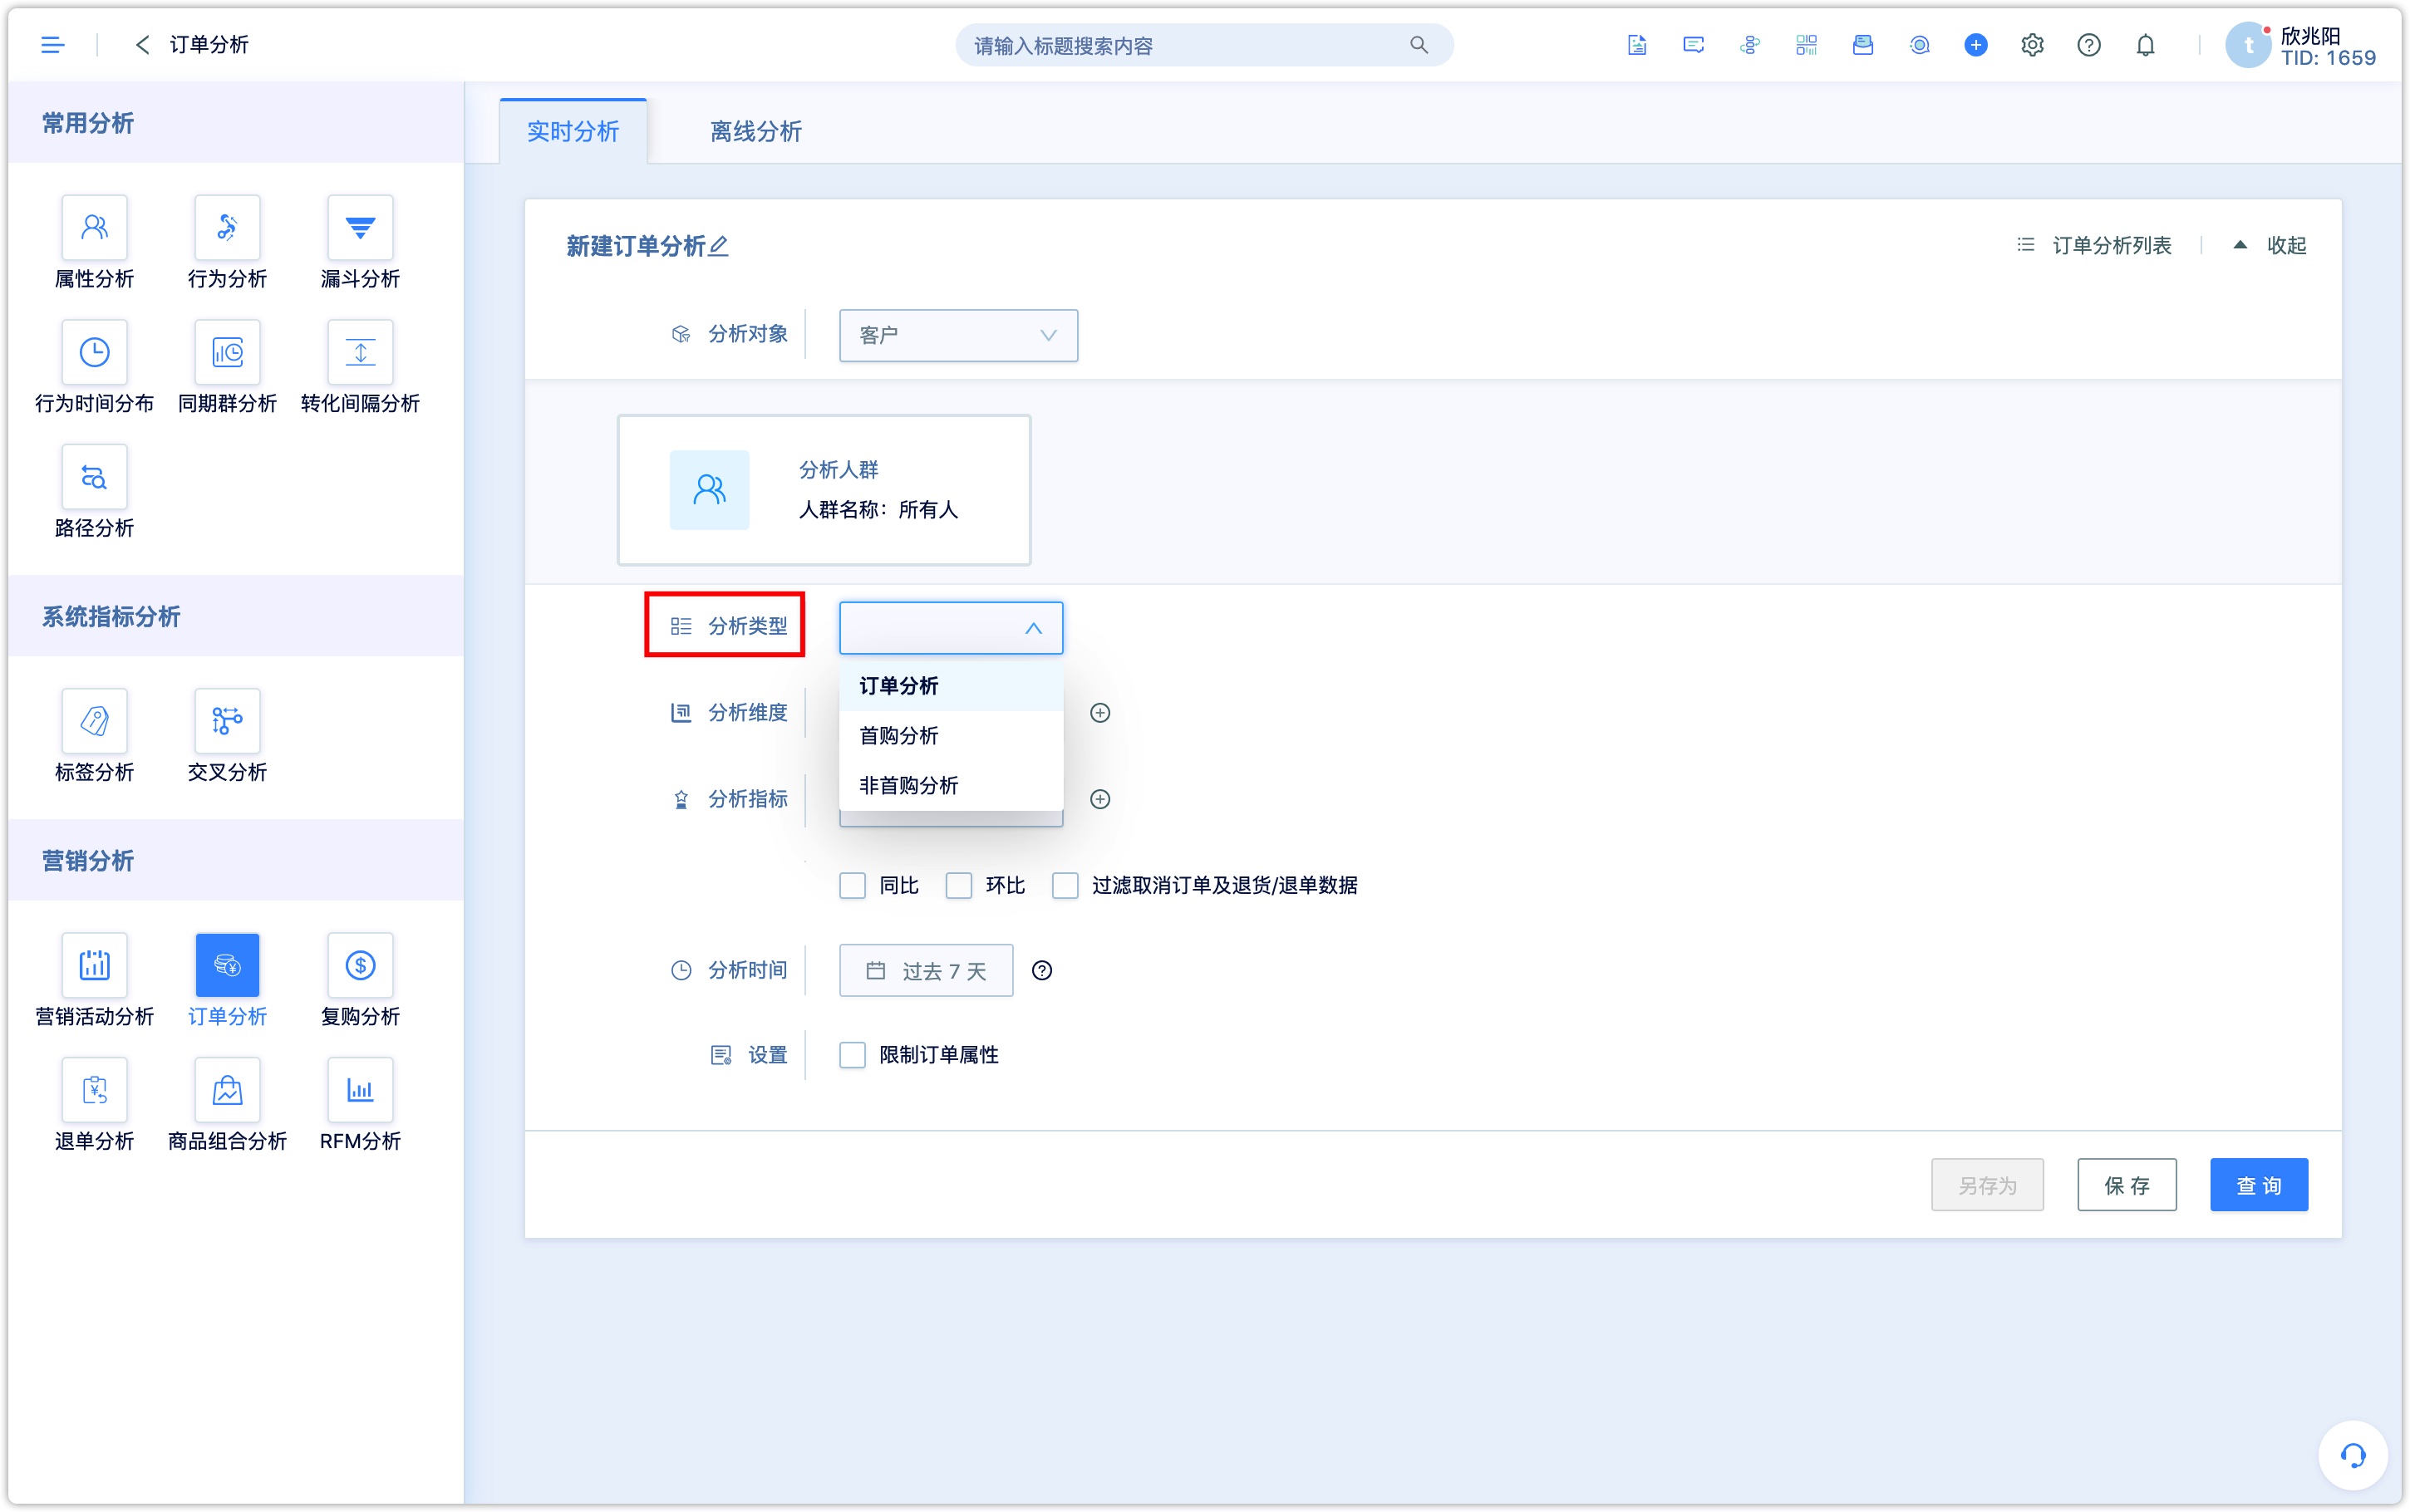
- Order analysis:analyze all orders of the selected object.
- First purchase analysis:analyze the first purchase order of the selected object.
- Non-first purchase analysis:analyze all orders of the selected object except the first order.
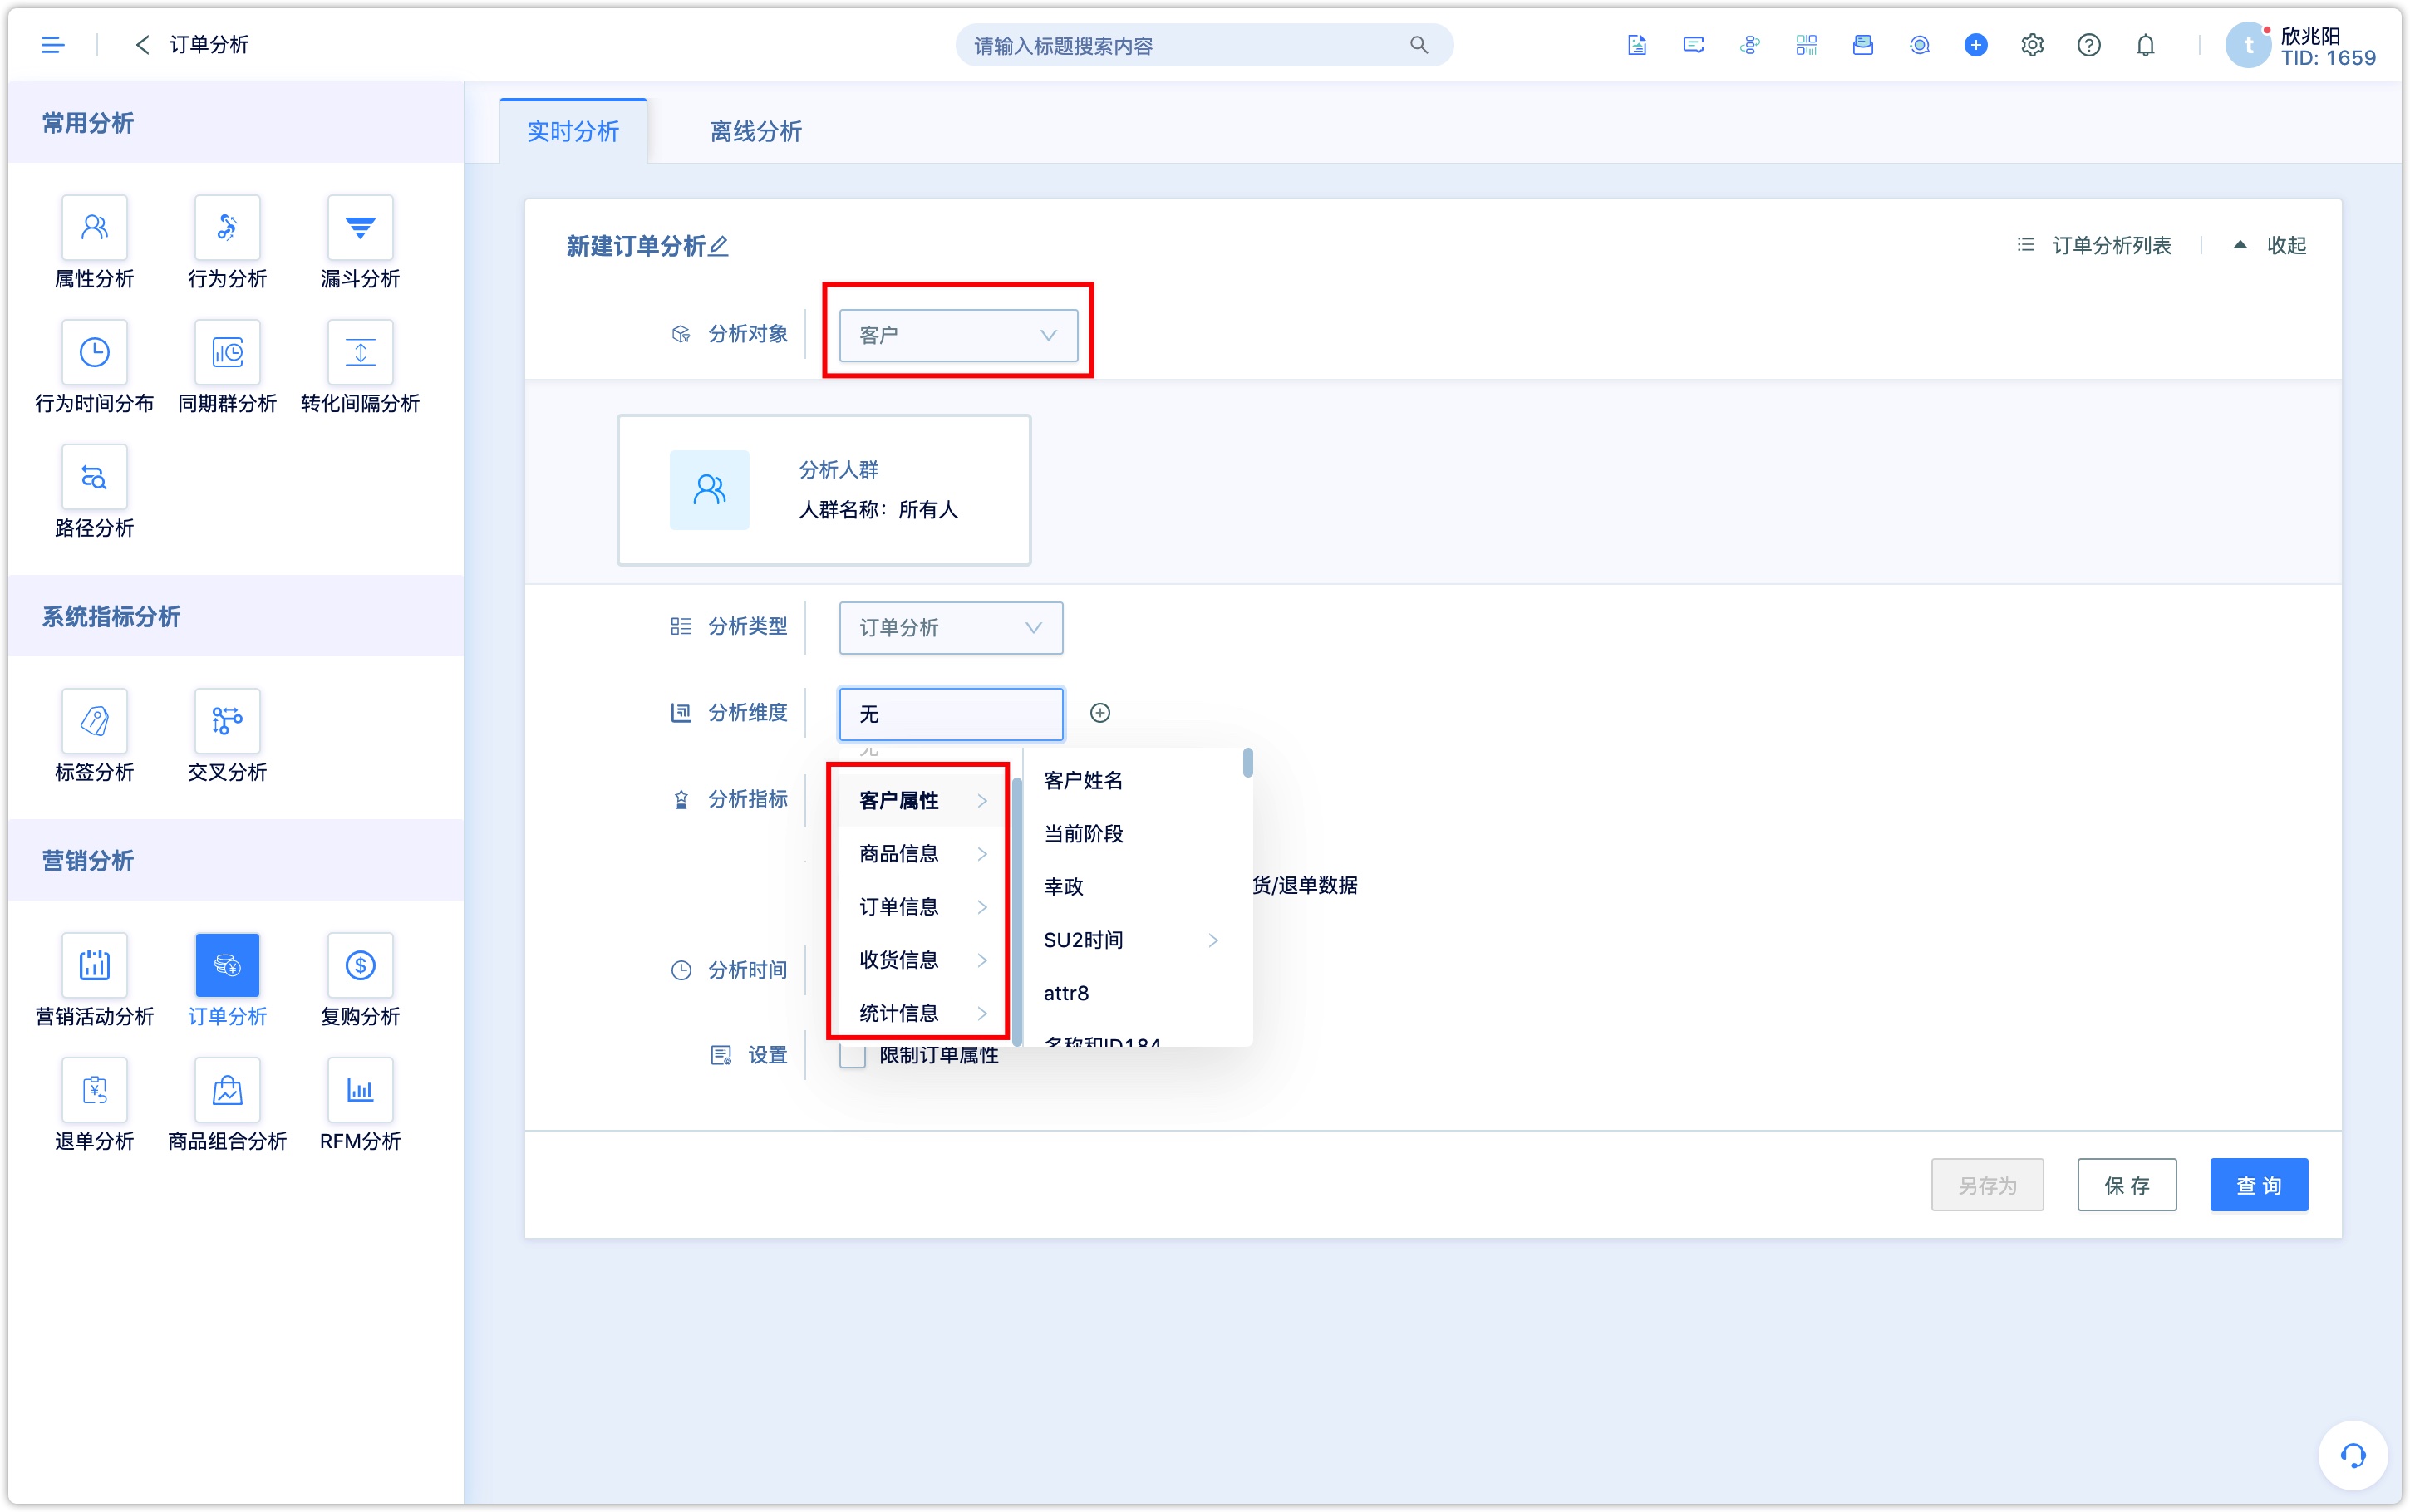
3.3Set analysis dimensions
The analysis dimension and the analysis object also have a corresponding relation. When the analysis object is customers, the analysis dimensions can be customer attributes, goods’ information, order information, receipt information, and statistical information.
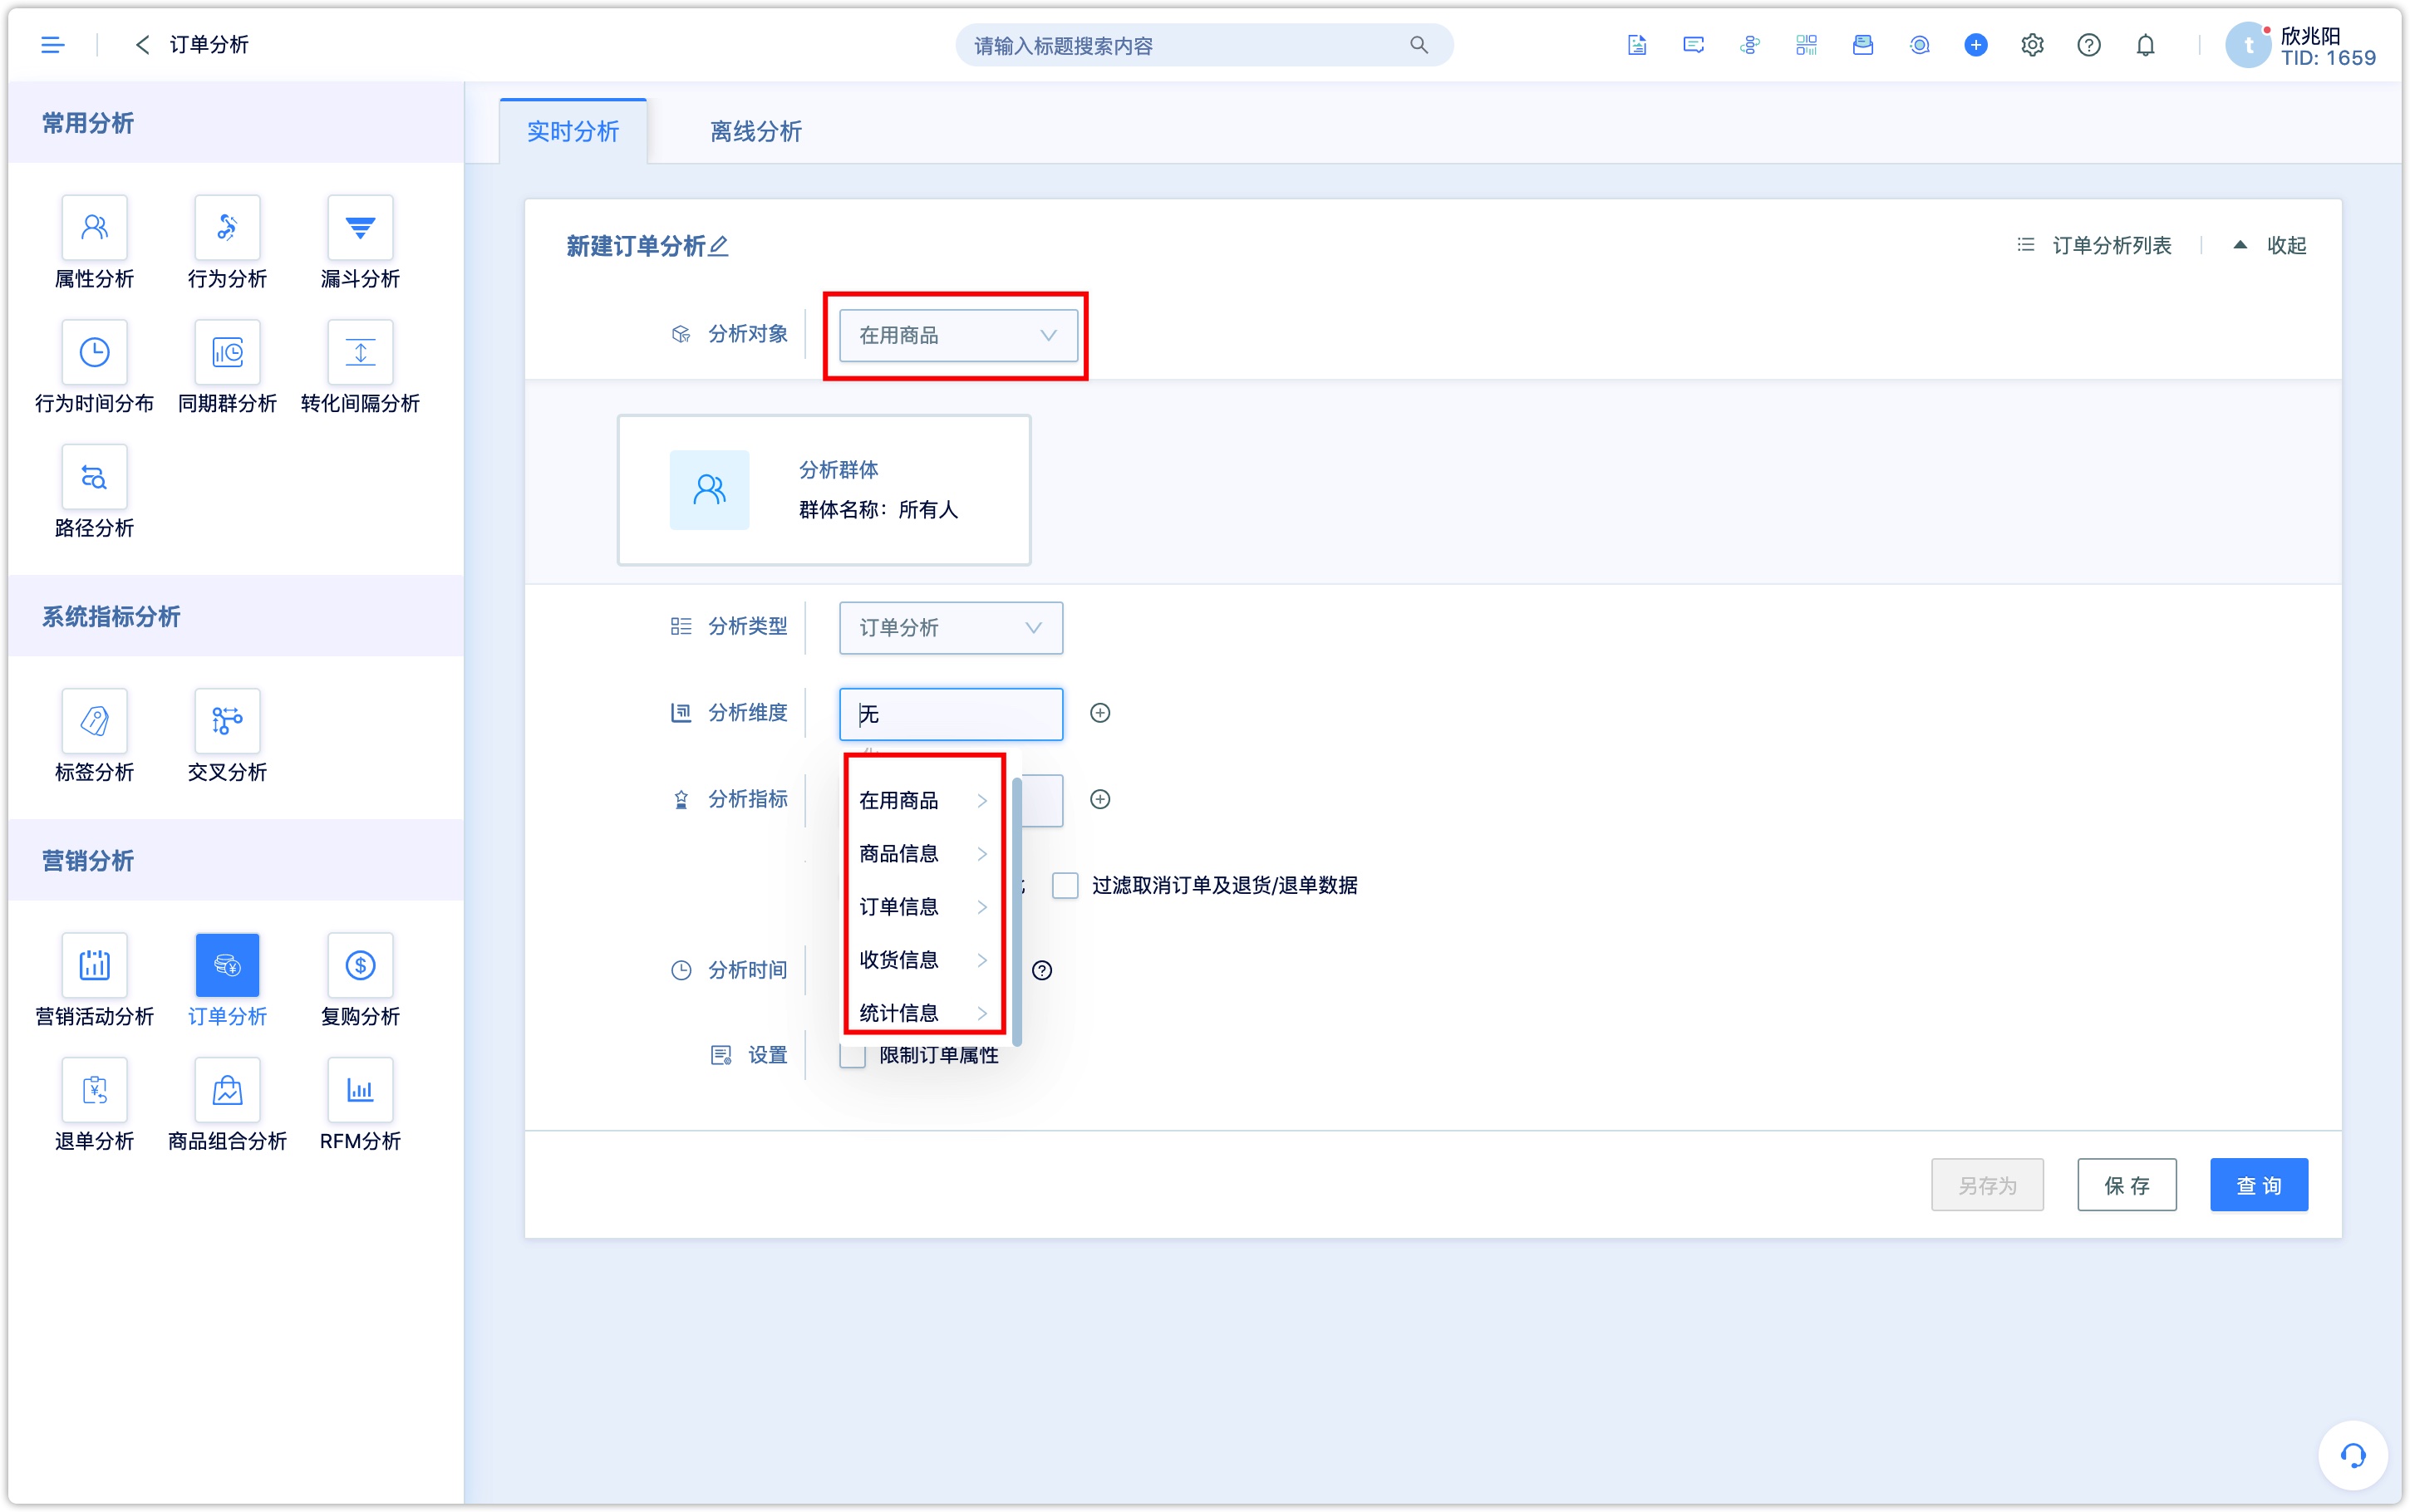
When the analysis object is “goods in use”, the analysis dimensions are goods in use, goods’ information, order information, order information, receipt information, and statistical information.
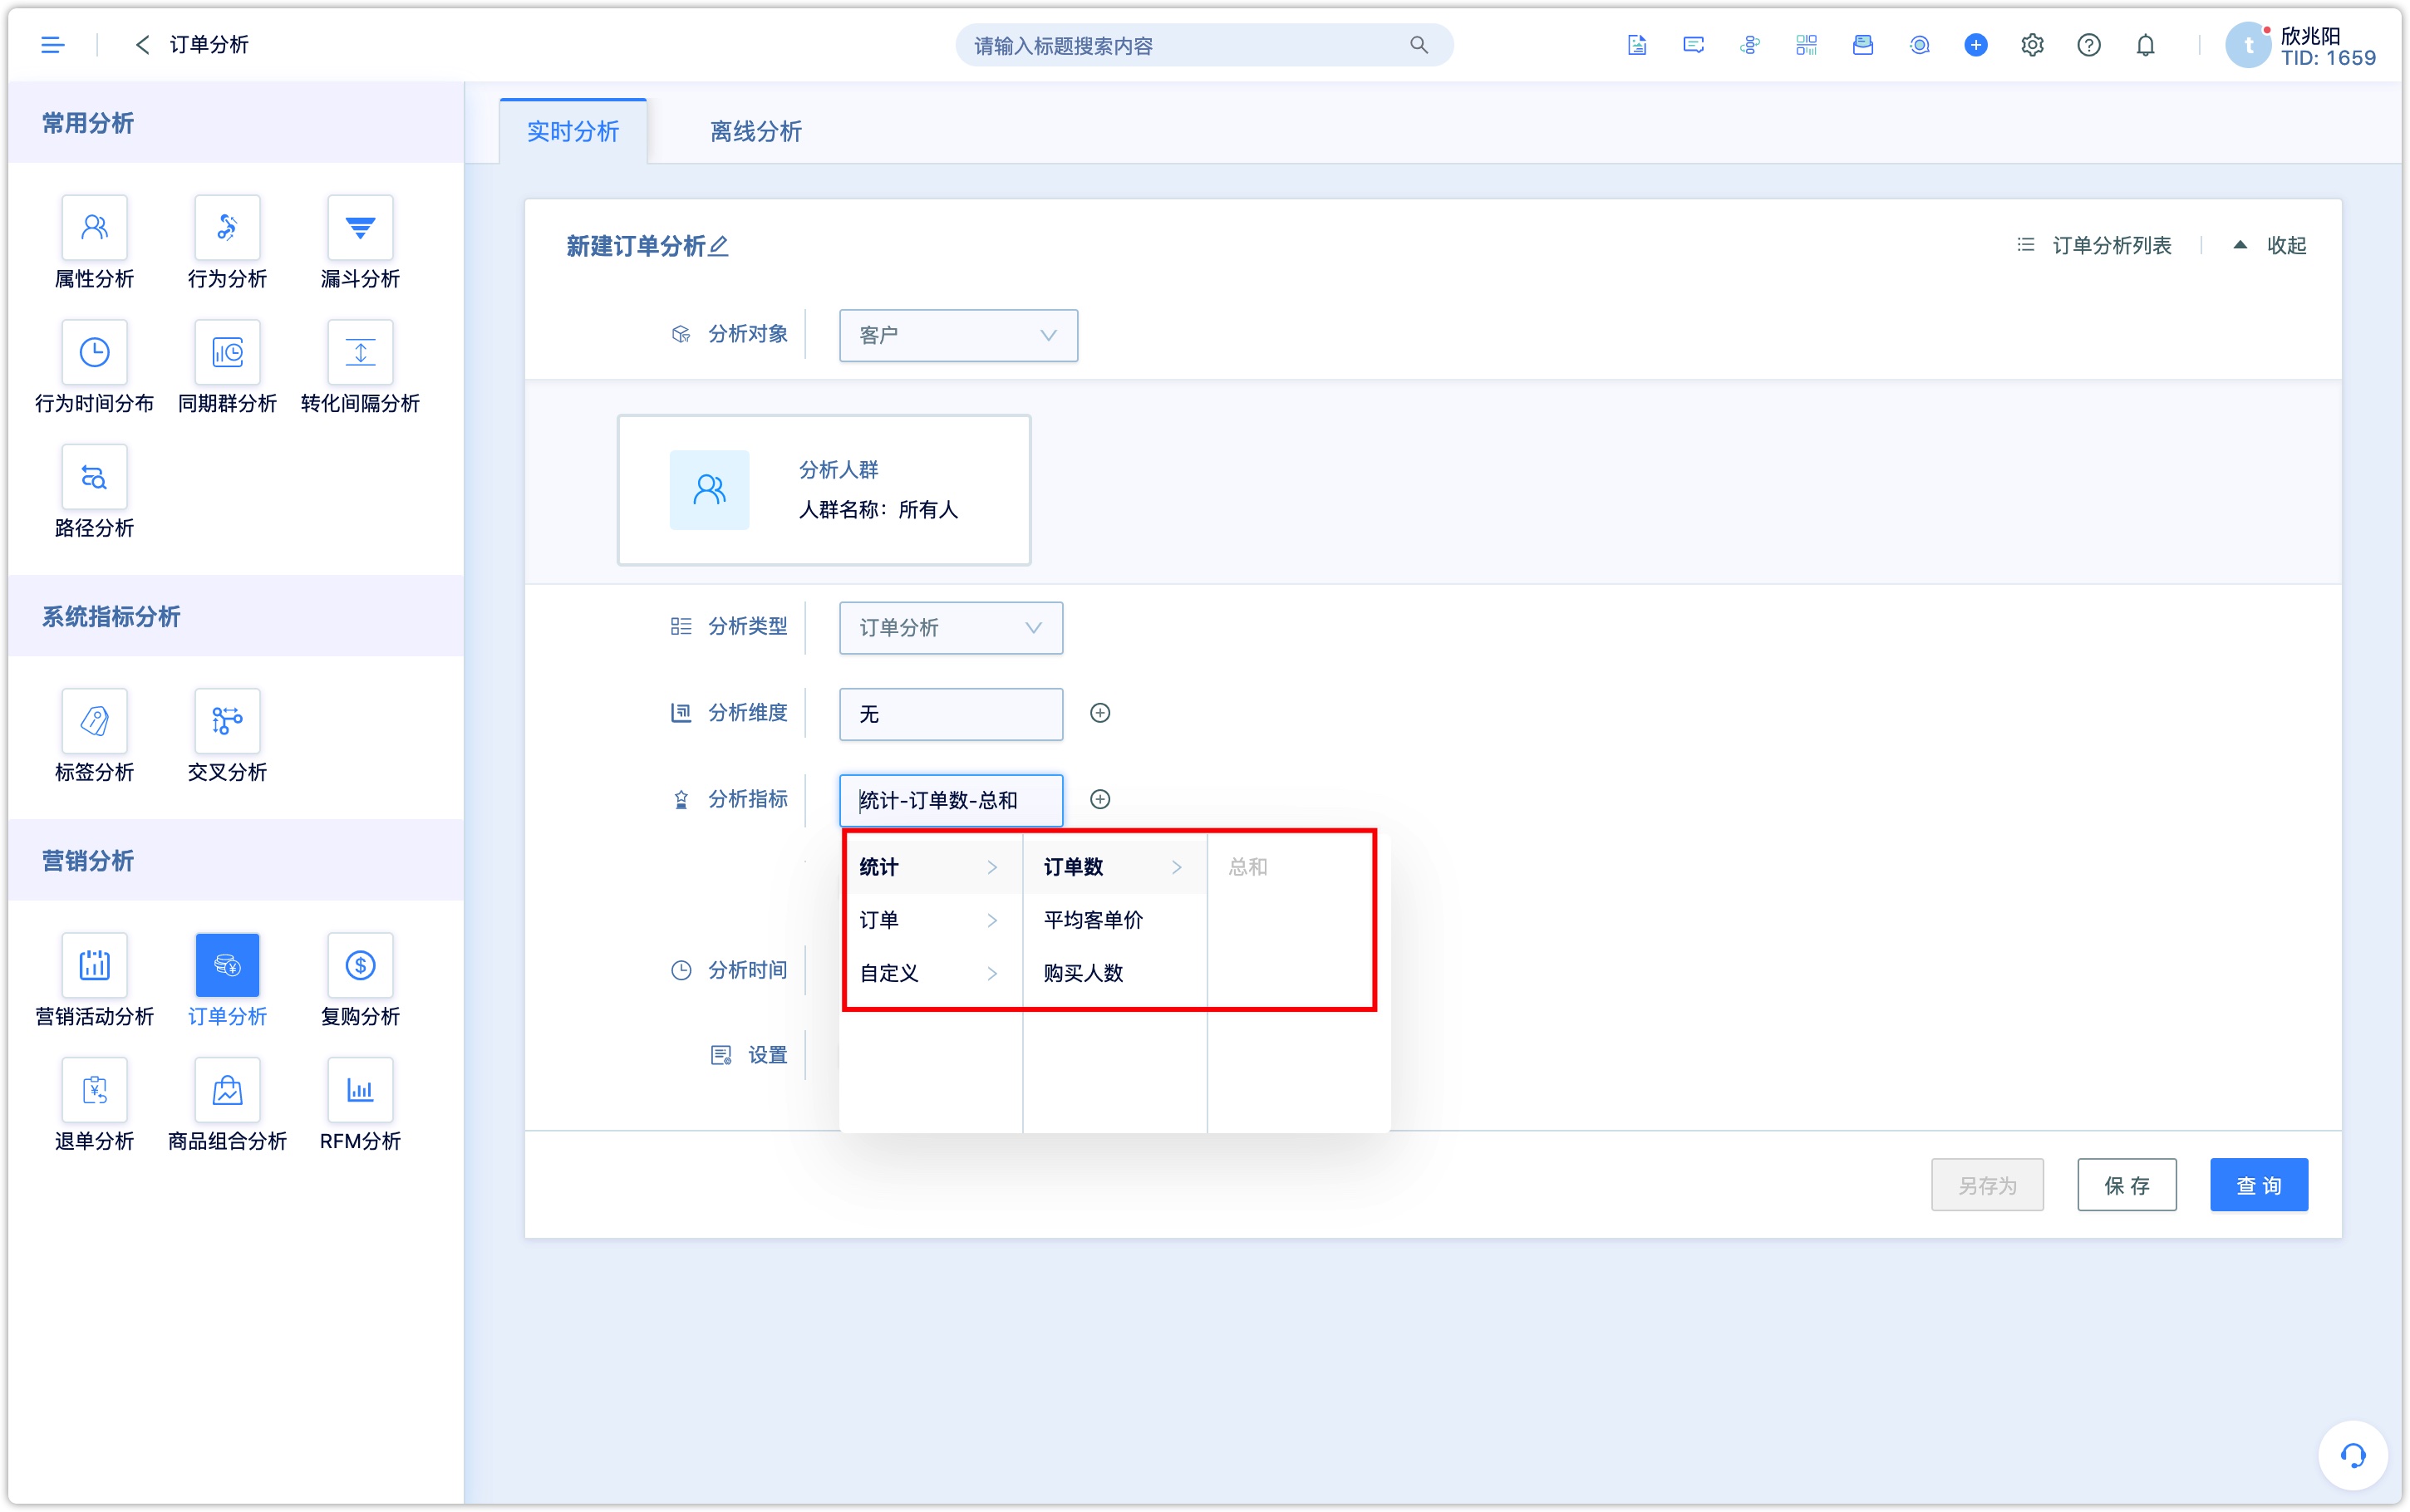
3.4Selecting analysis indexes
Whether the analysis object is a customer or goods in use, there are statistics and order related indexes provided. Furthermore, when the analysis object is a customer, the index can be customized.
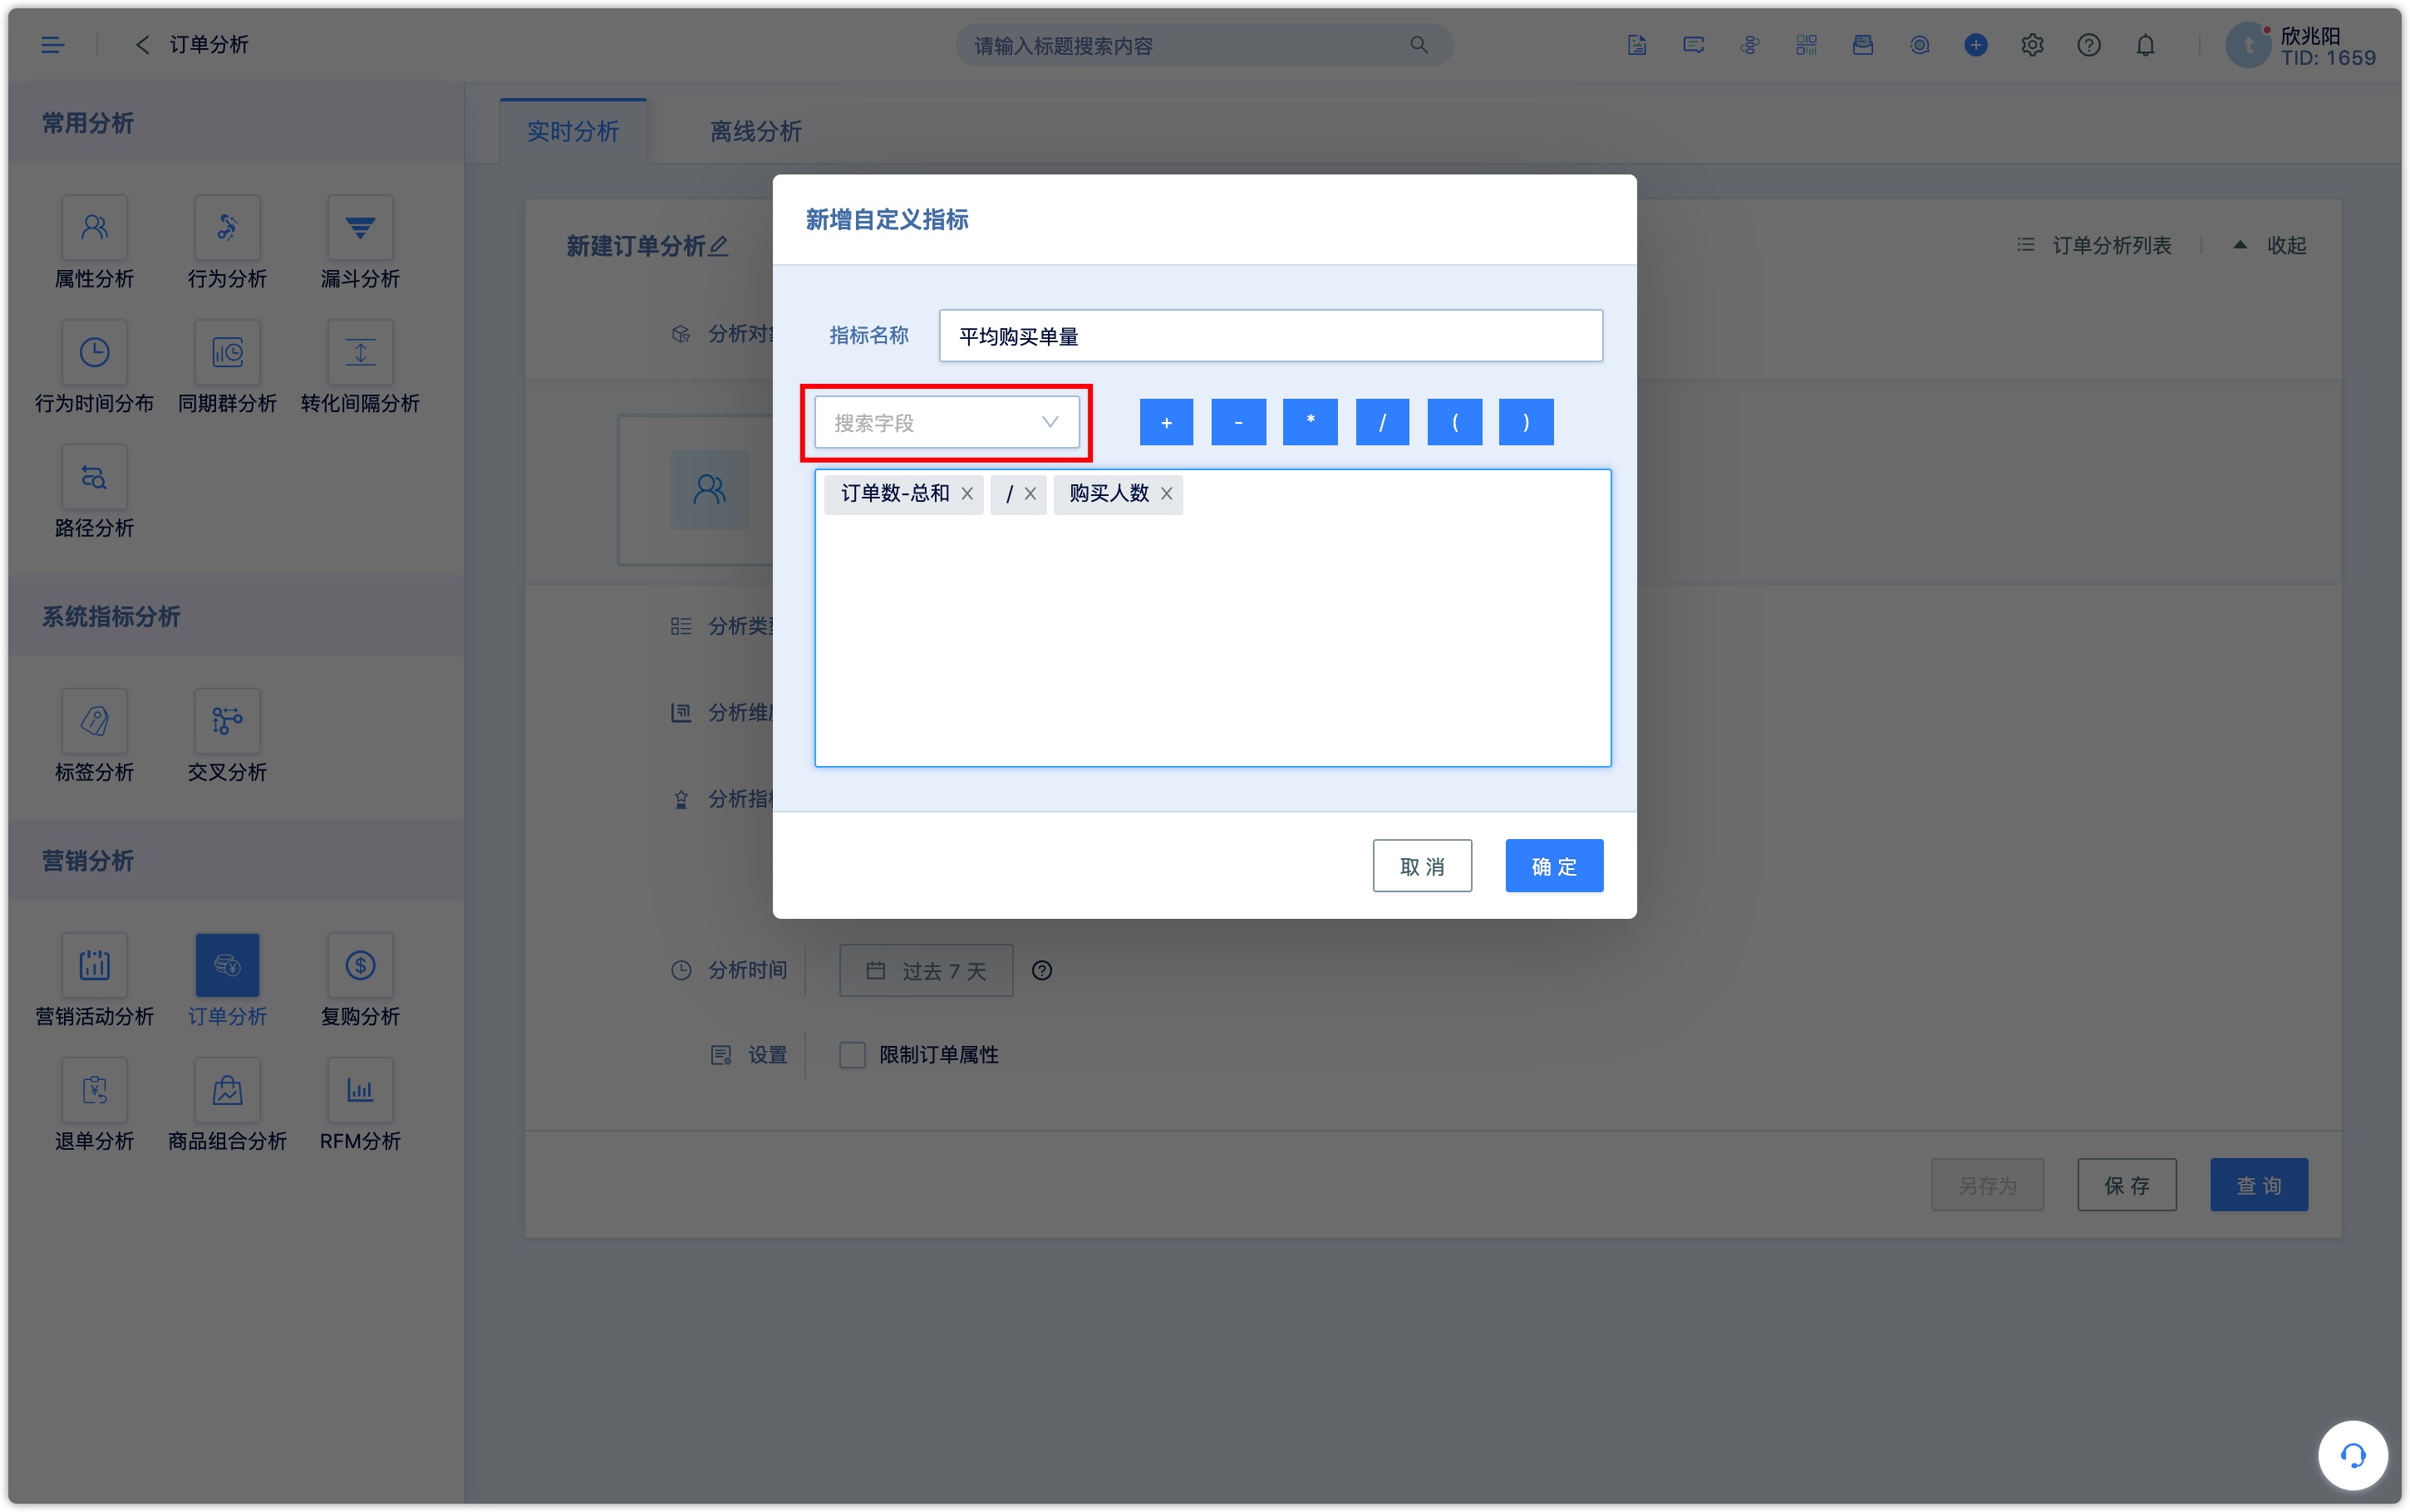
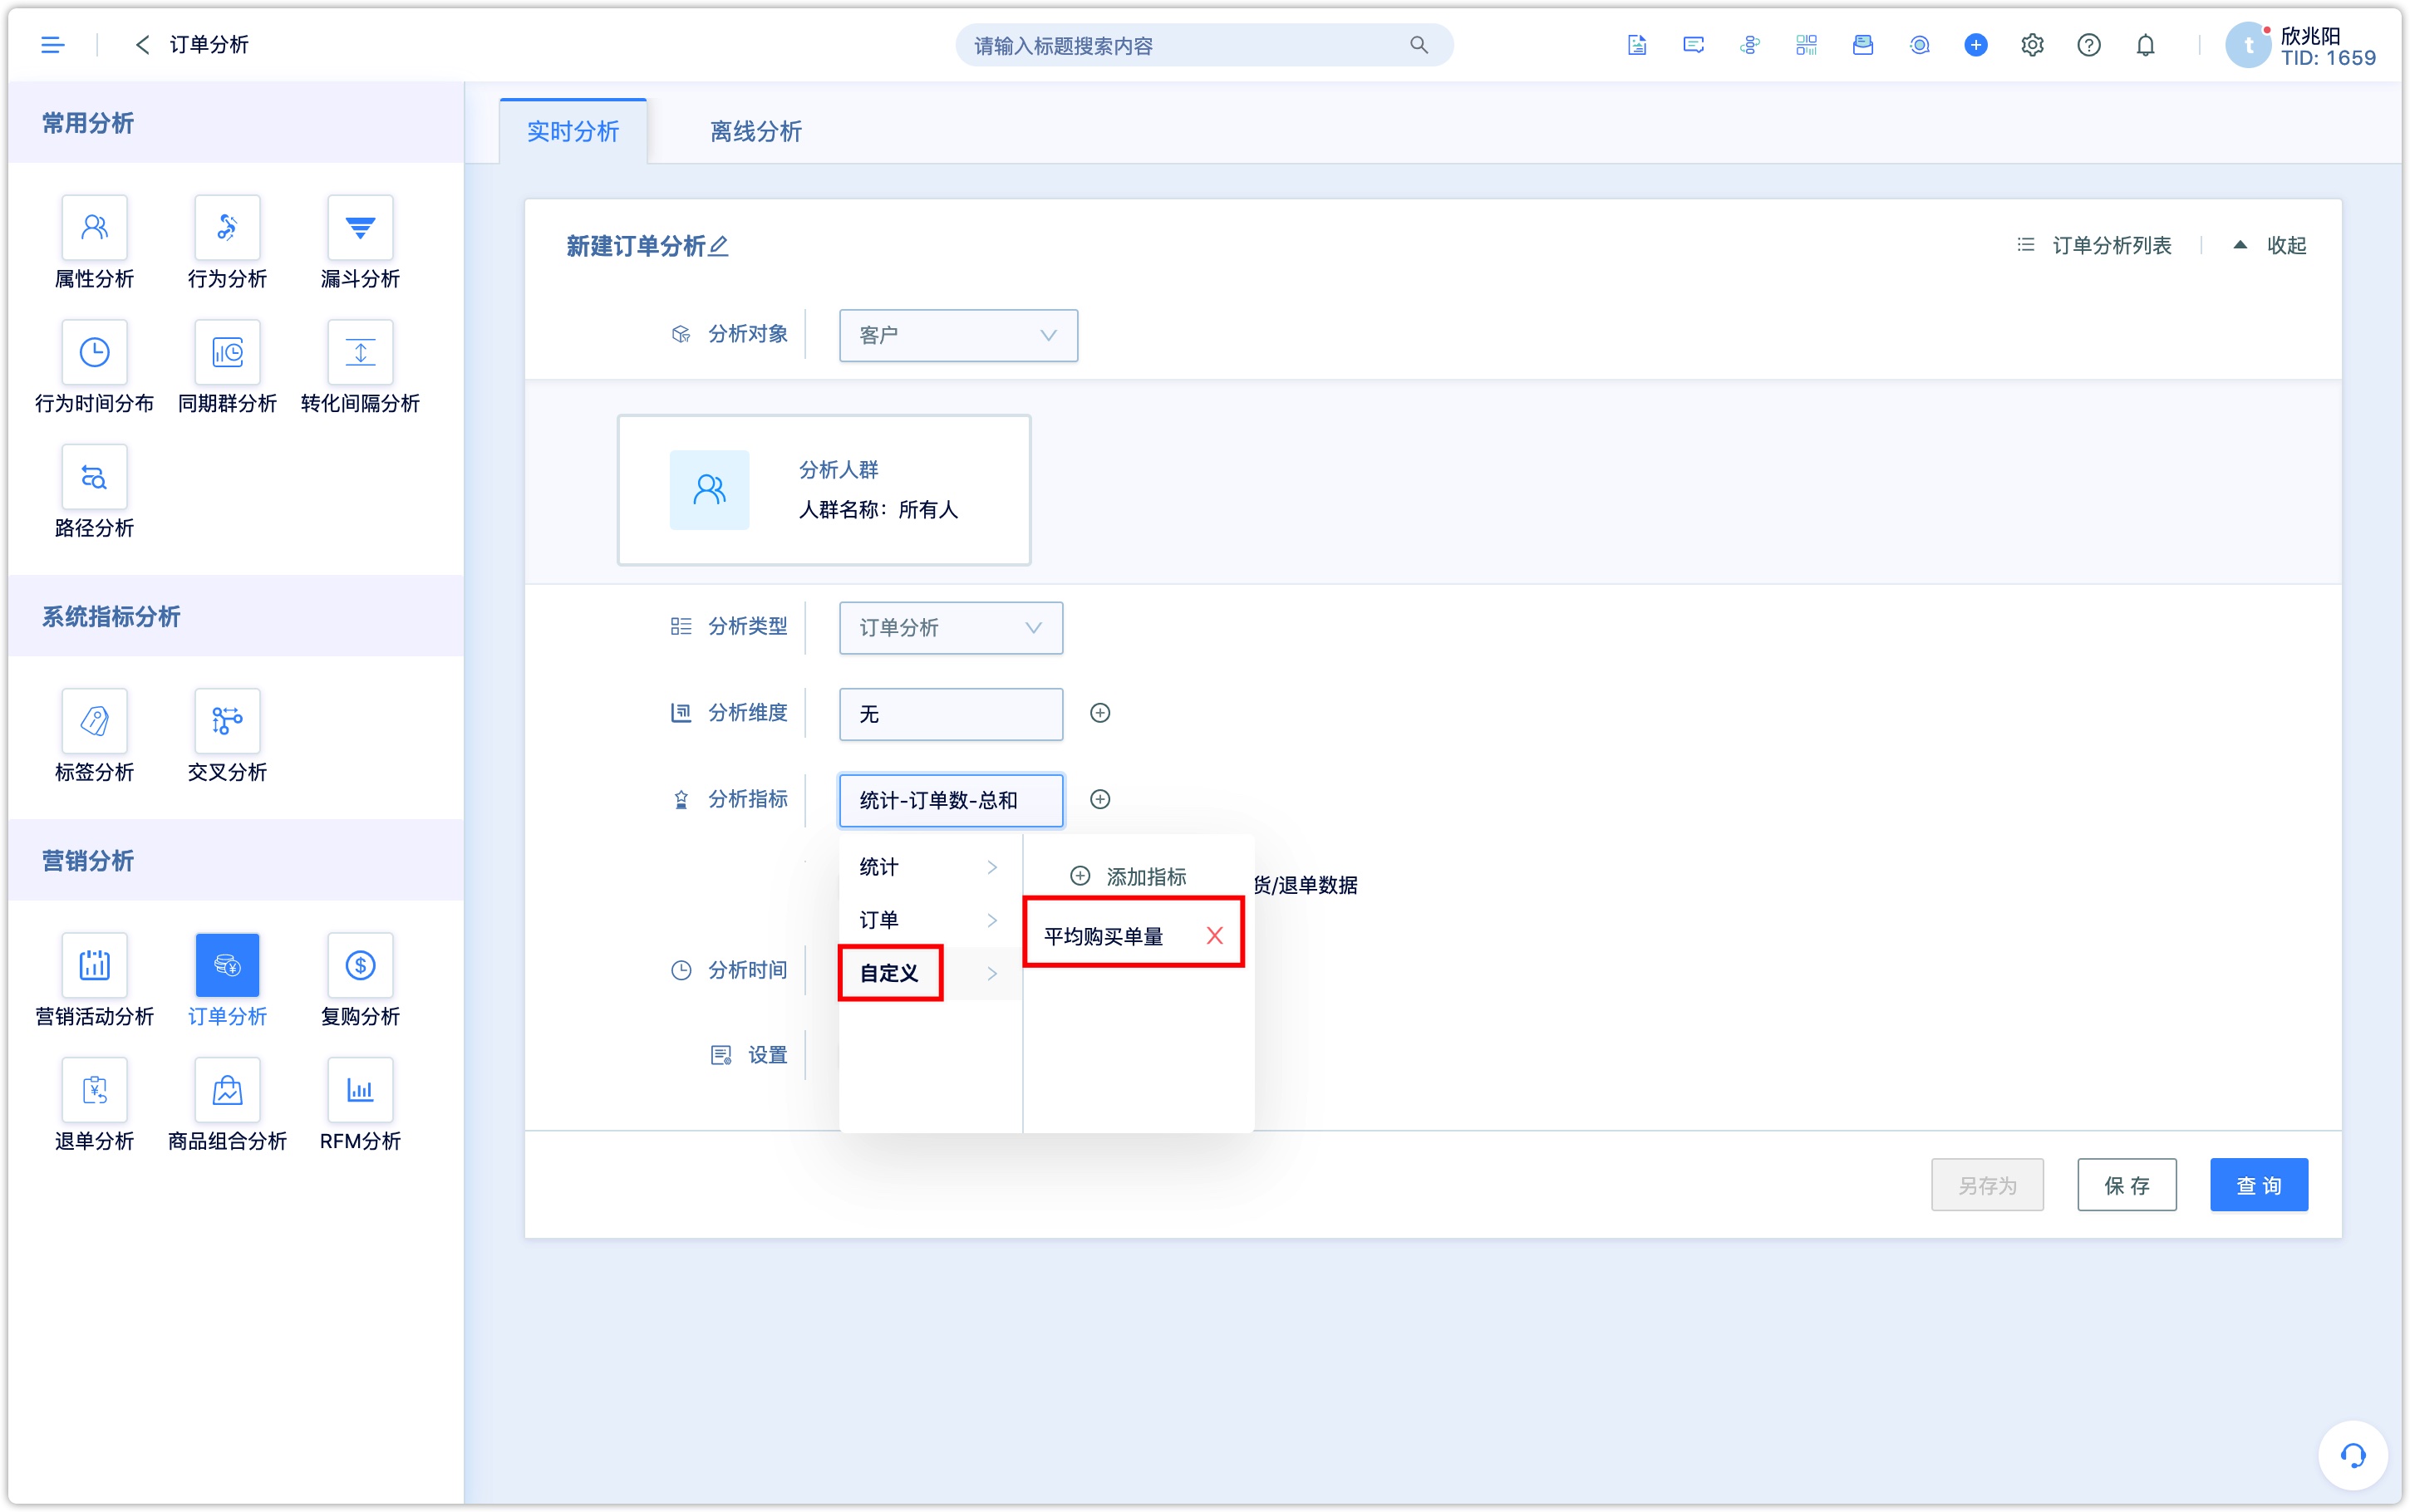
- Custom index: Add new custom index by adding, subtracting, multiplying, and dividing the system preset indexes or numeric type fields. For example, add per transaction quantity as the analysis index, as shown in the below figure.
Analysis indexes can also set year-on-year, month-on-month, filter out cancellation order and goods-return /order-return data.
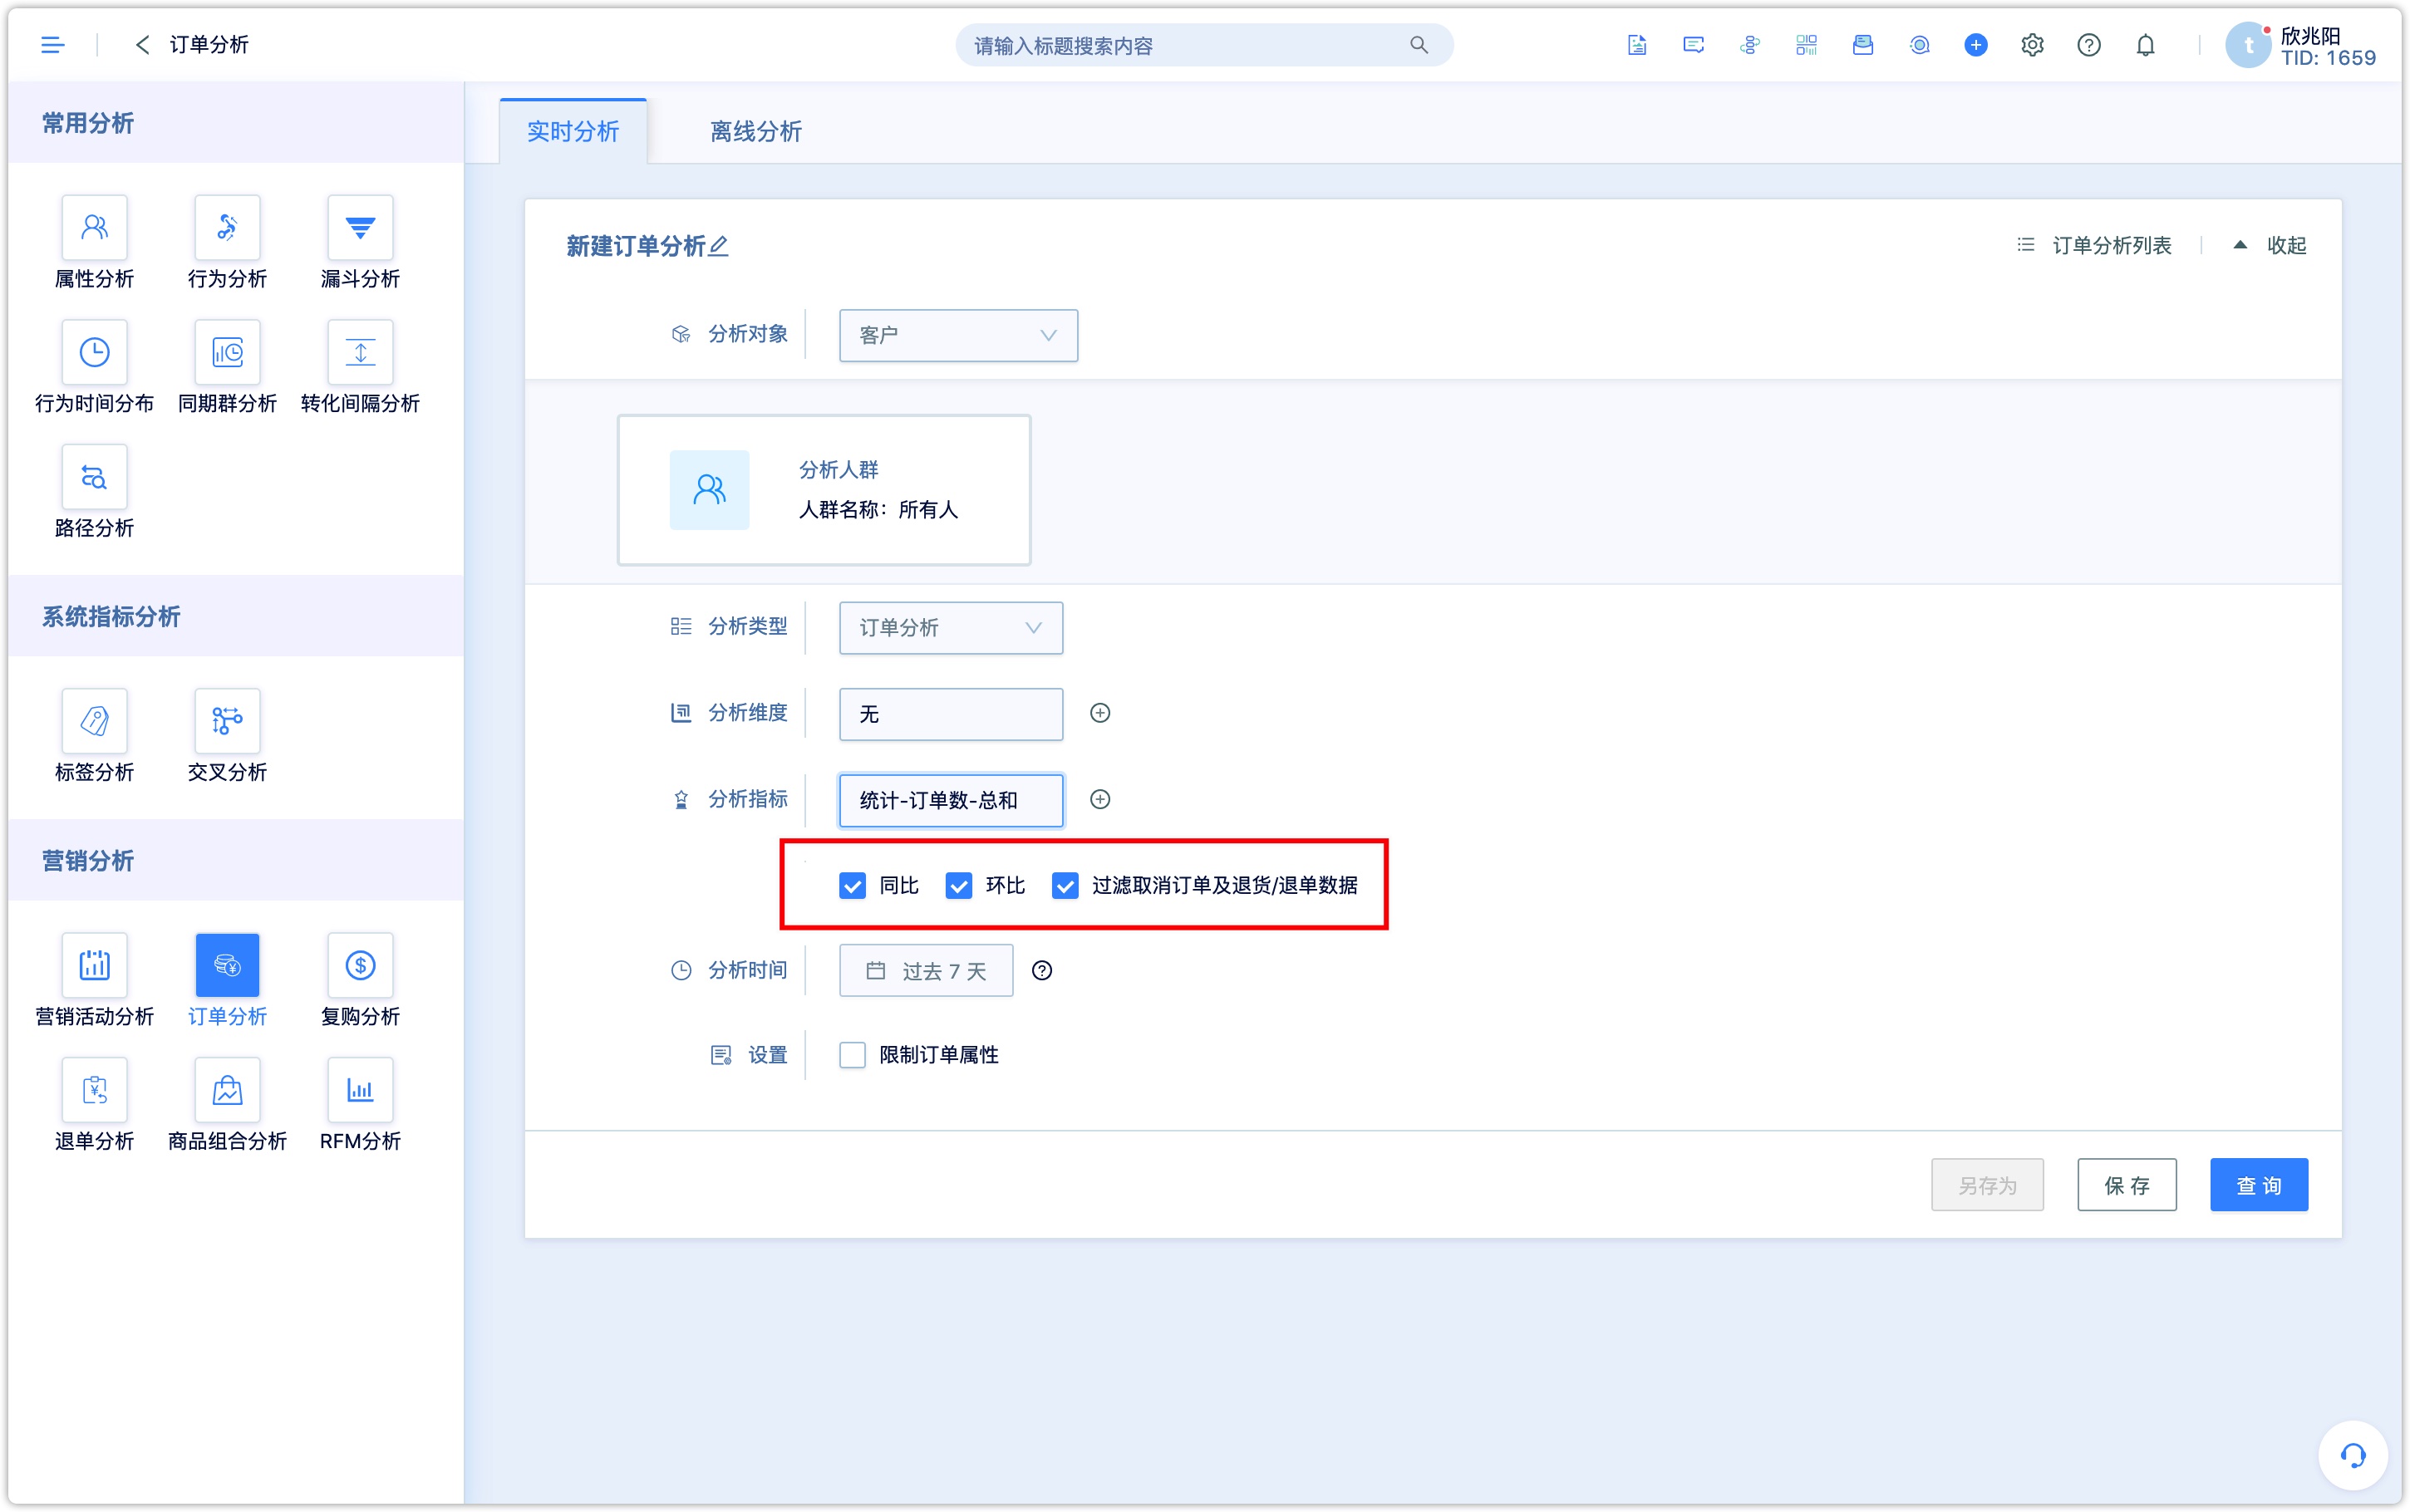
- Year-on-year:Compare with the data of the same period of last year, such as comparing the data of January 2021 and January 2020.
- Month-on-month:Comparison of the change of the amount in two consecutive statistical periods, such as comparing the data of January 2021 and December 2020.
- Filter out cancellation order and good-return order/order-return data:The default setting is that all the order data would be analyzed. Only when this option is checked, the goods-return and order-return data be filtered out.
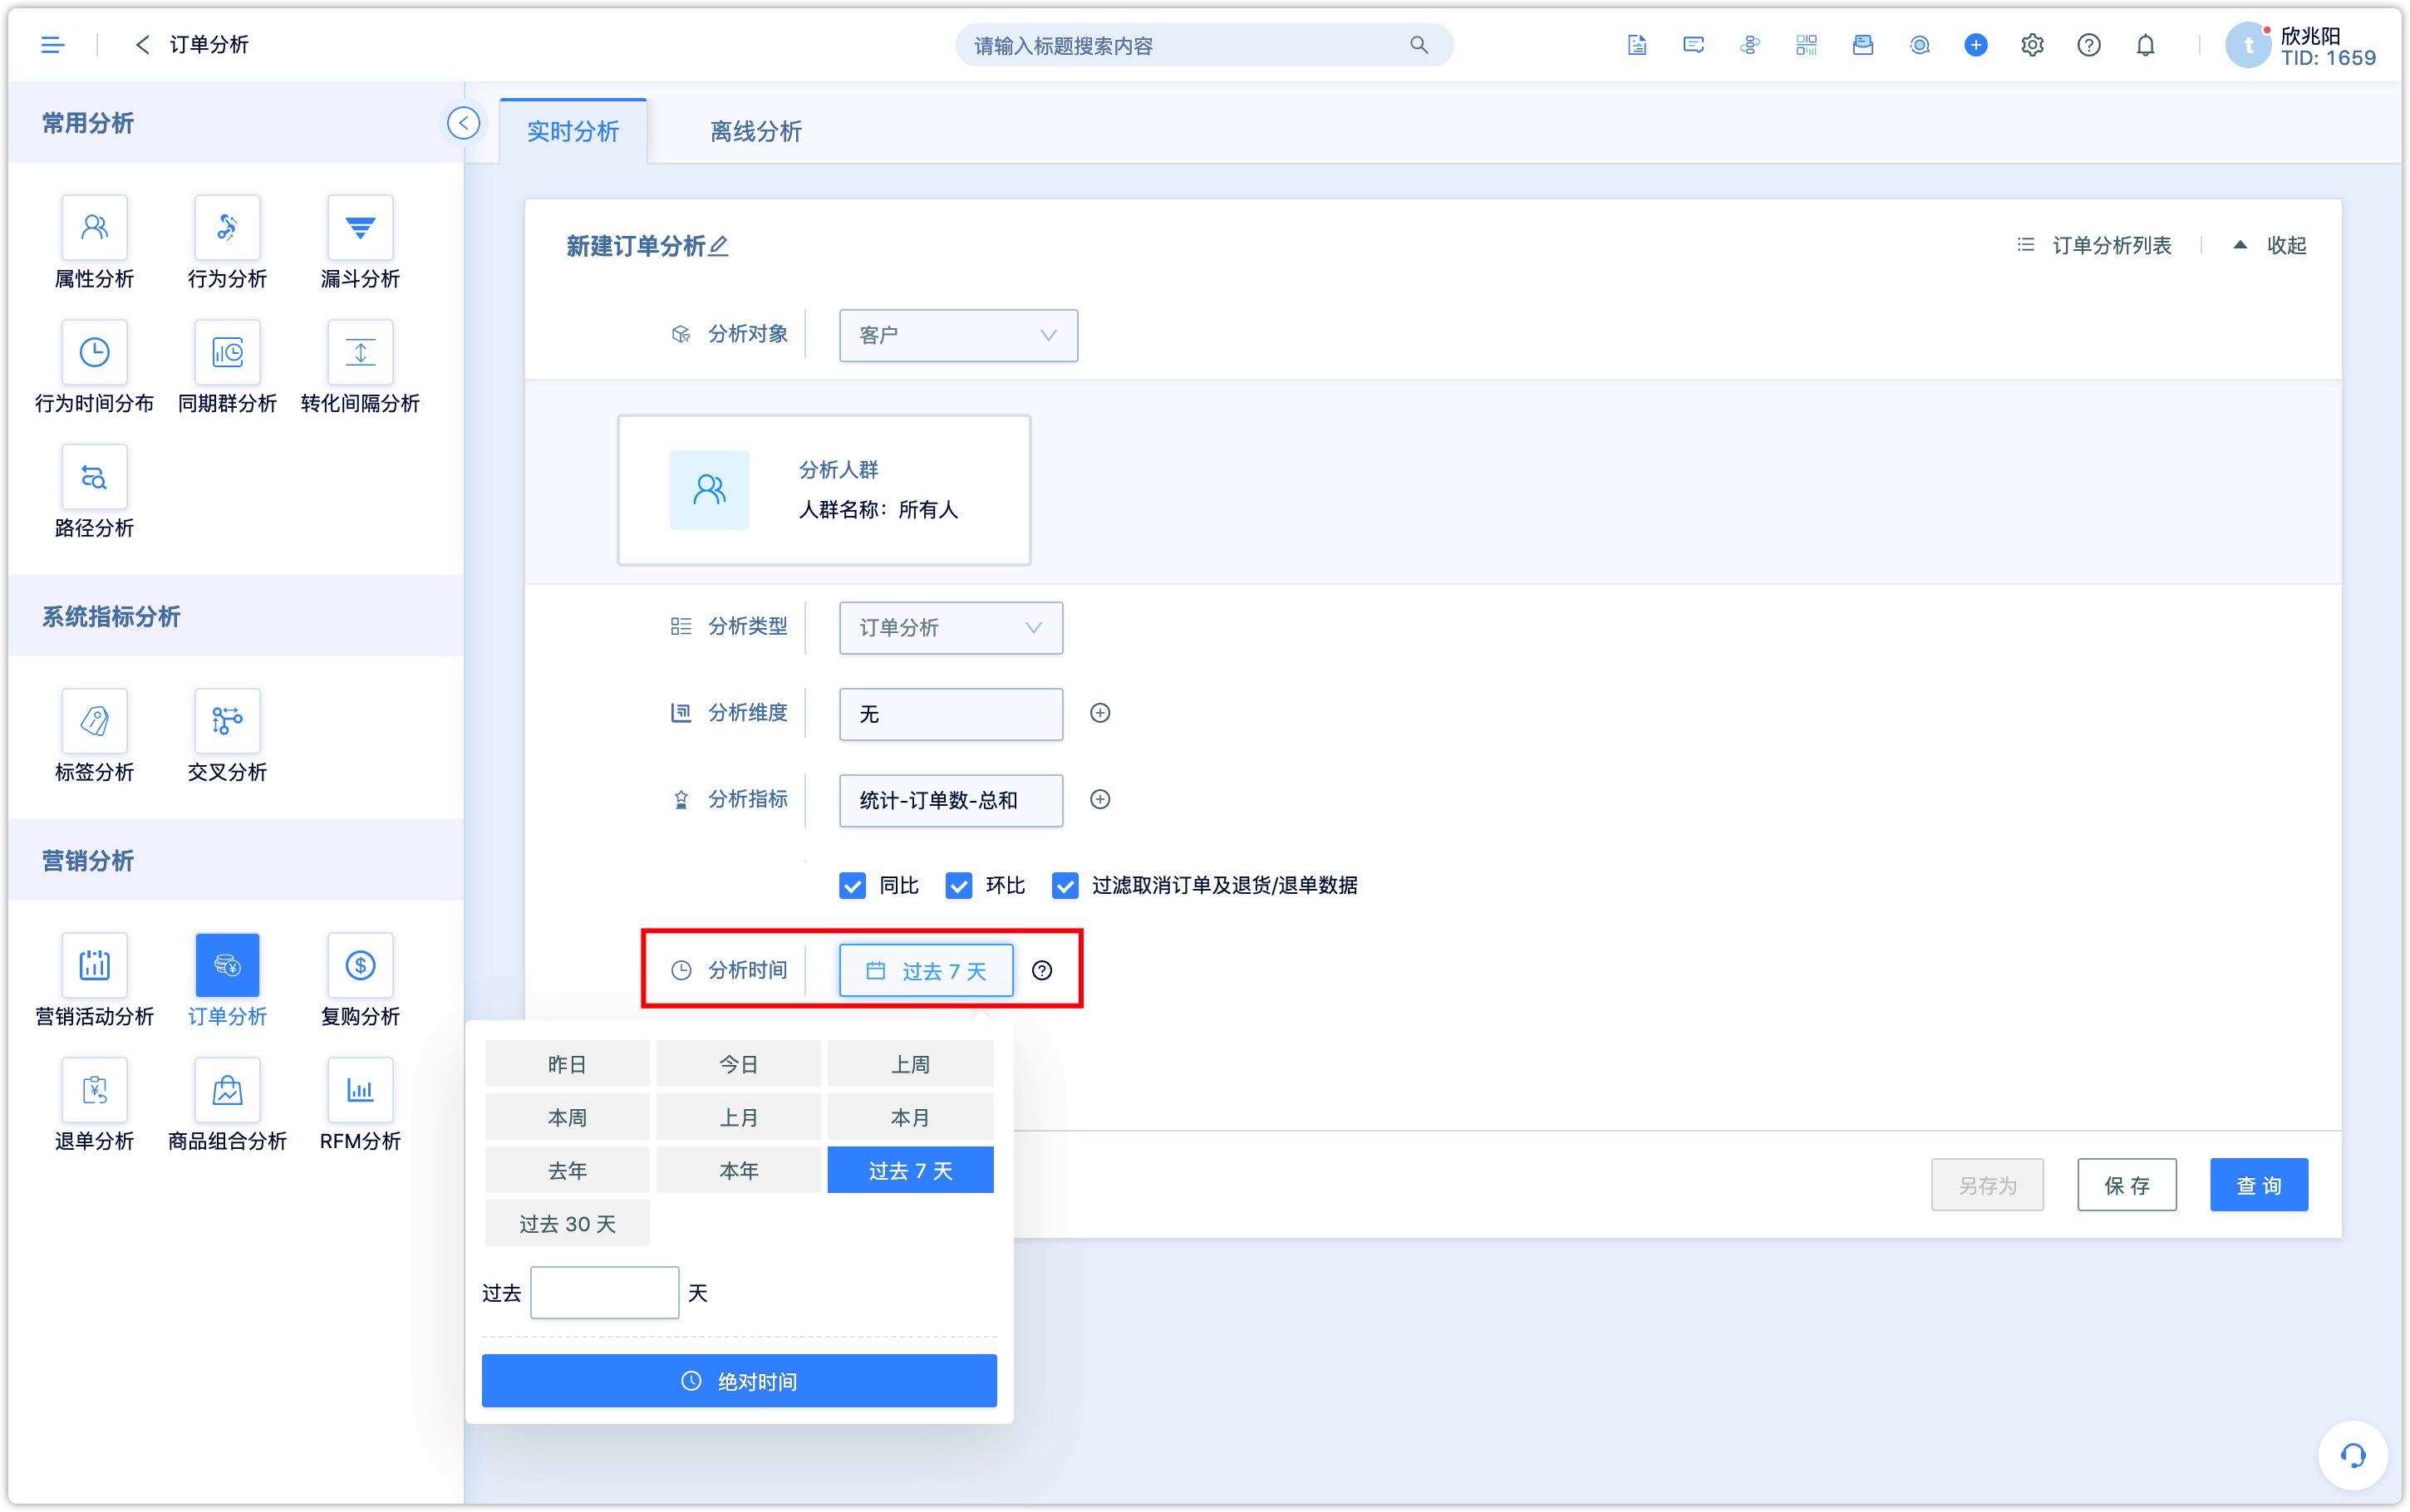
3.5Setting analysis range
Analysis time support selection of relative time and absolute time. Real-time analysis only supports real-time query within 365 days.。
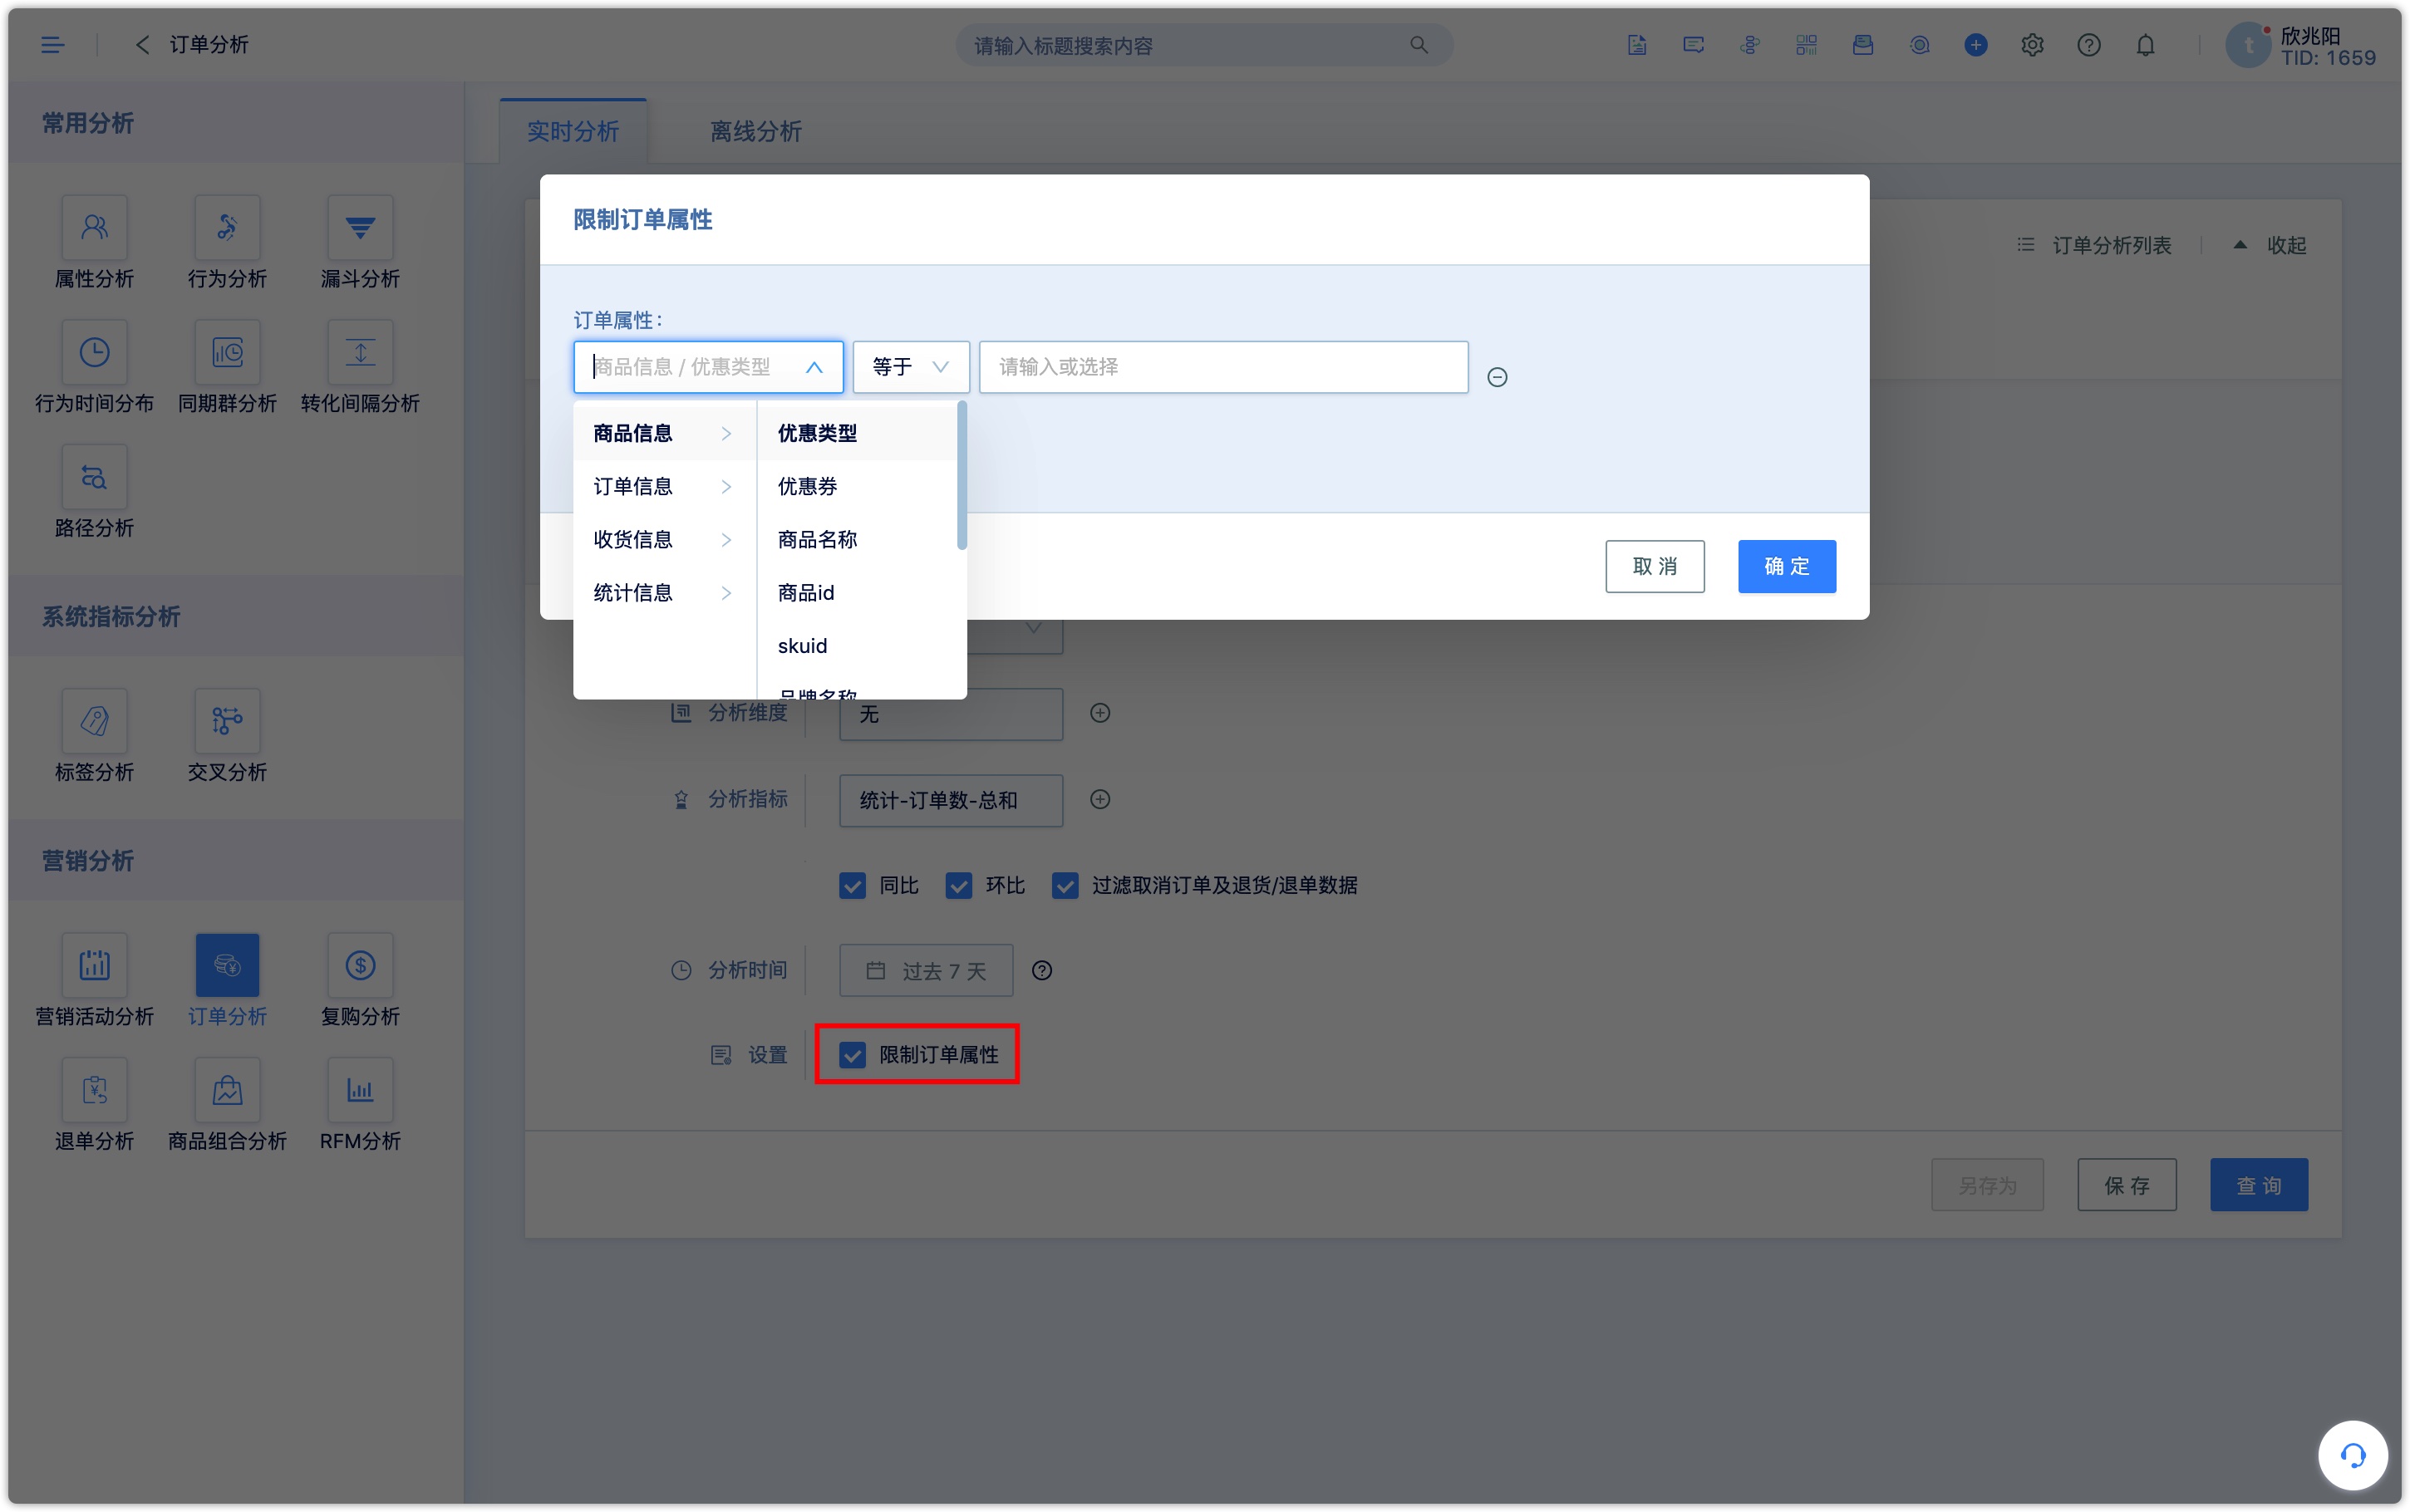
3.6Restrict order attributes
Limit order attributes by setting goods’ information, order information, receipt information, and statistical information.
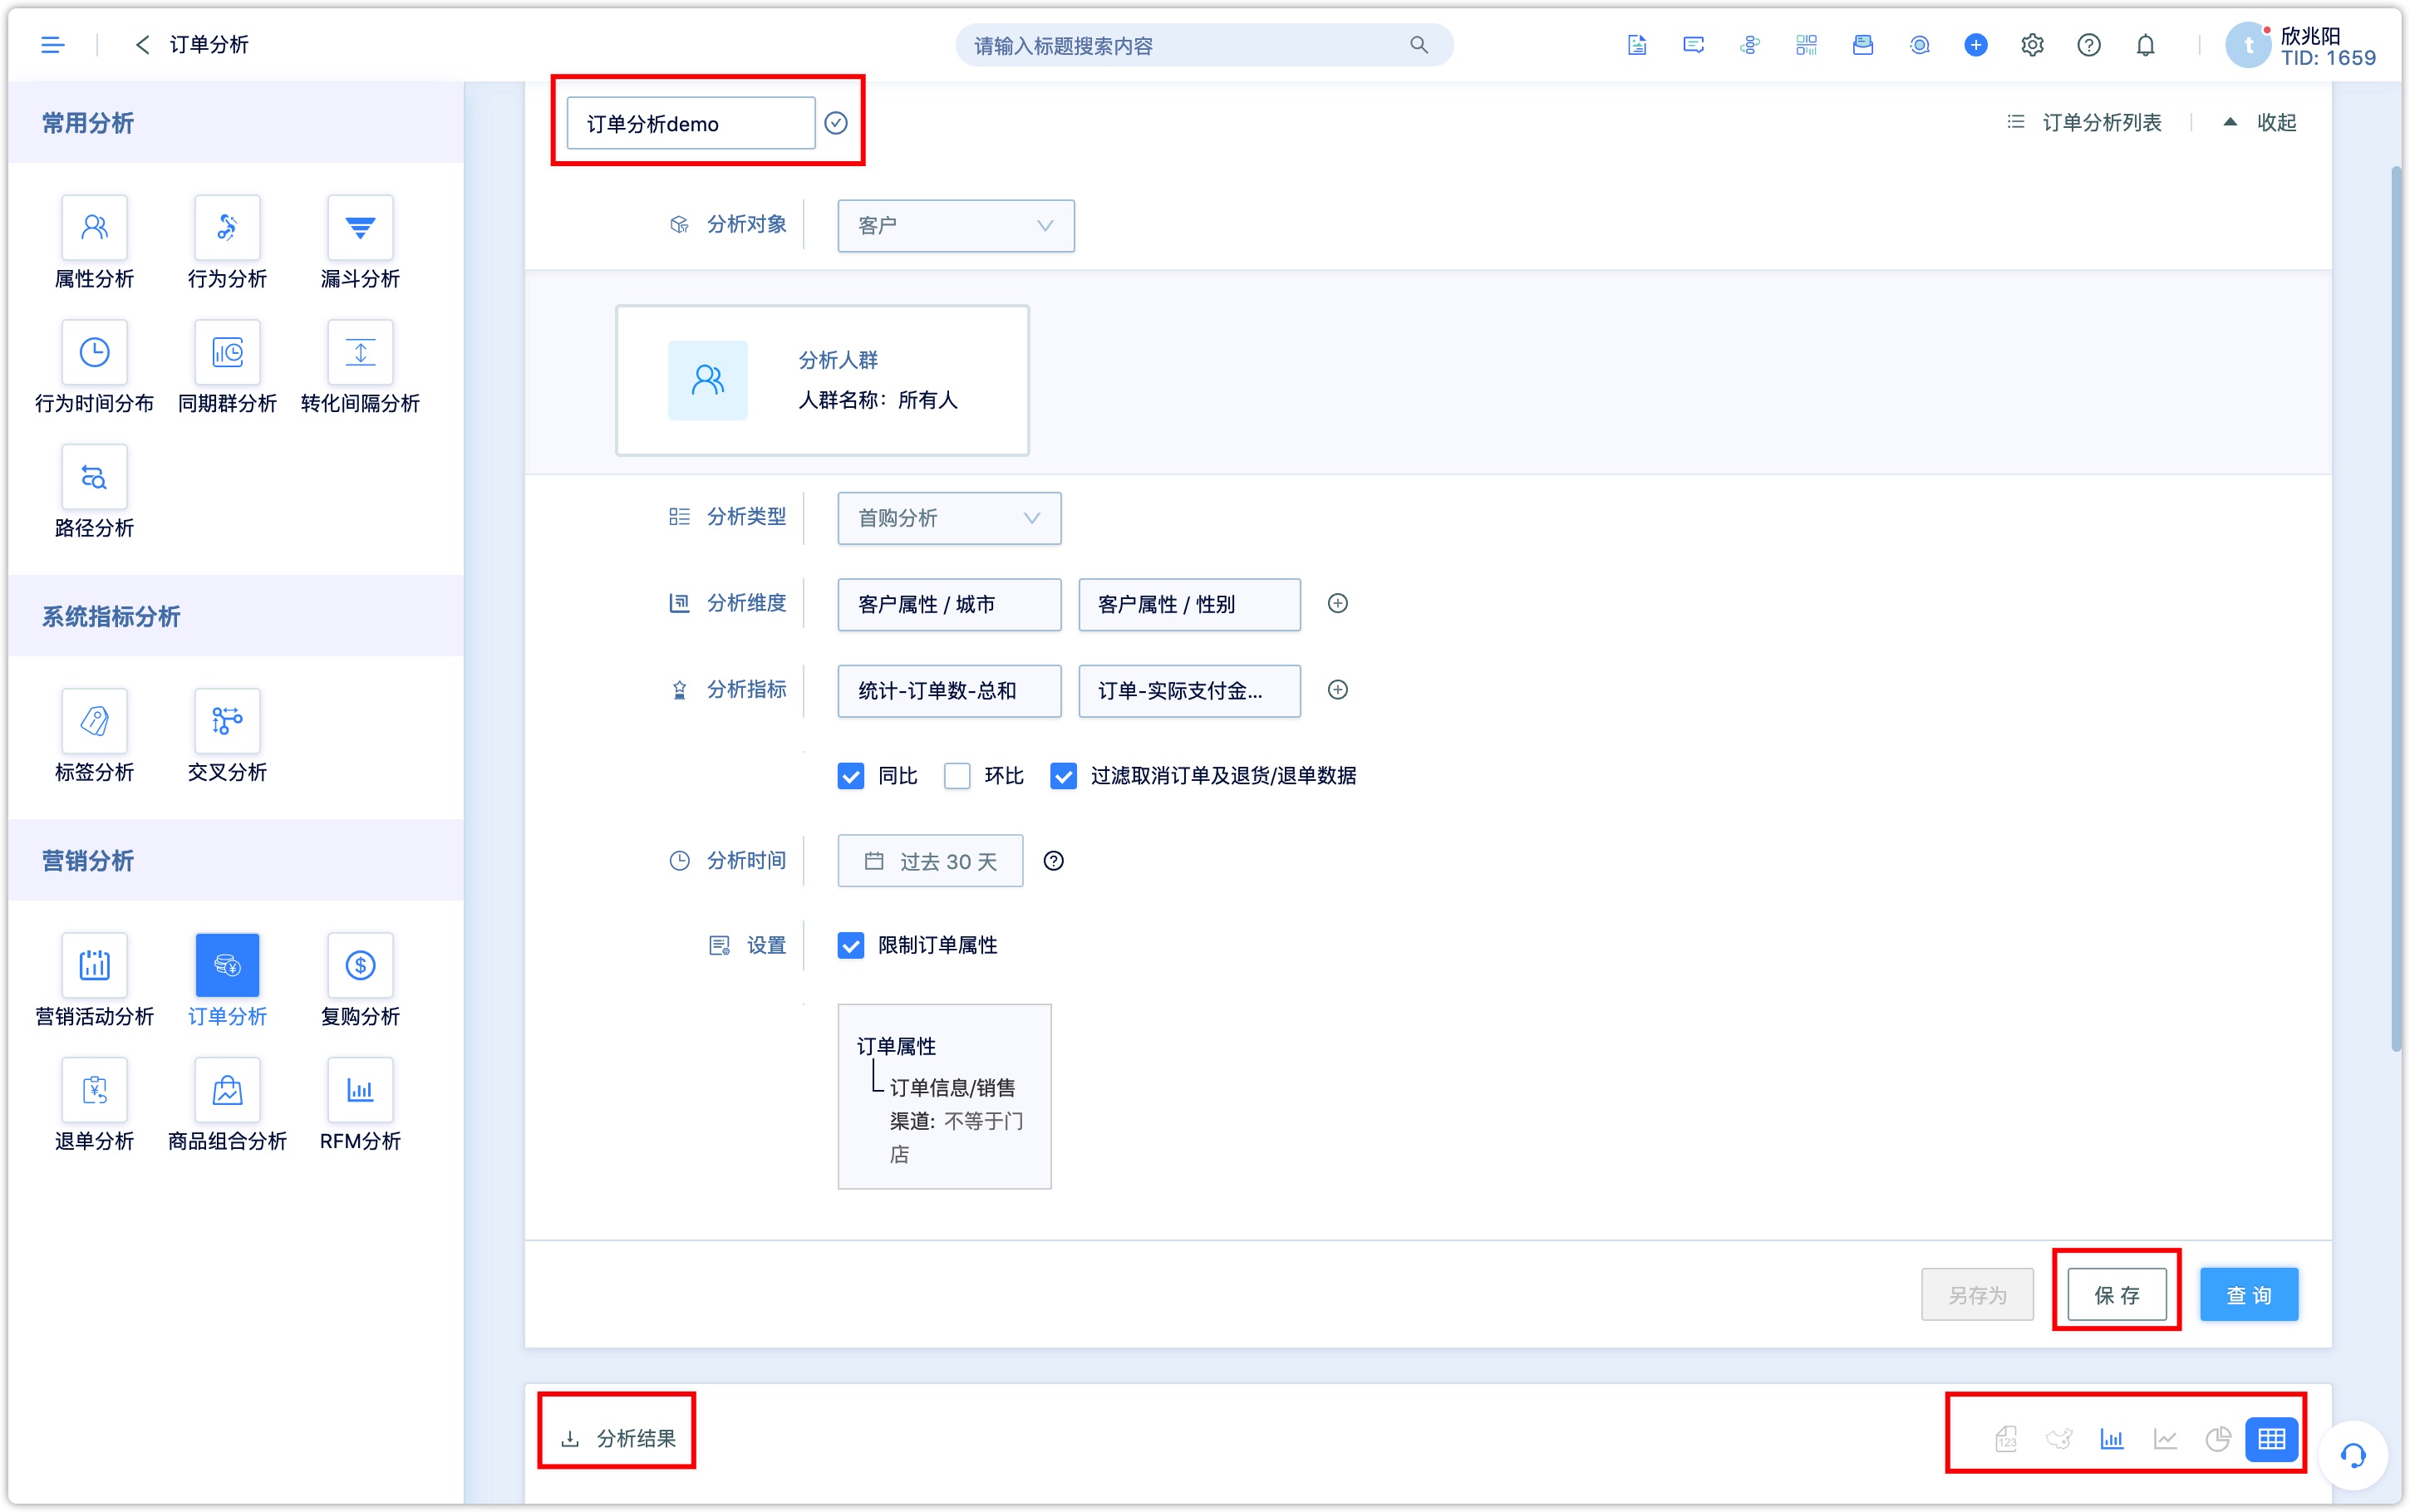
3.7 Saving and downloading analysis charts
Analysis chart can be downloaded directly or saved as a custom name.
4. A scenario example of real-time analysis
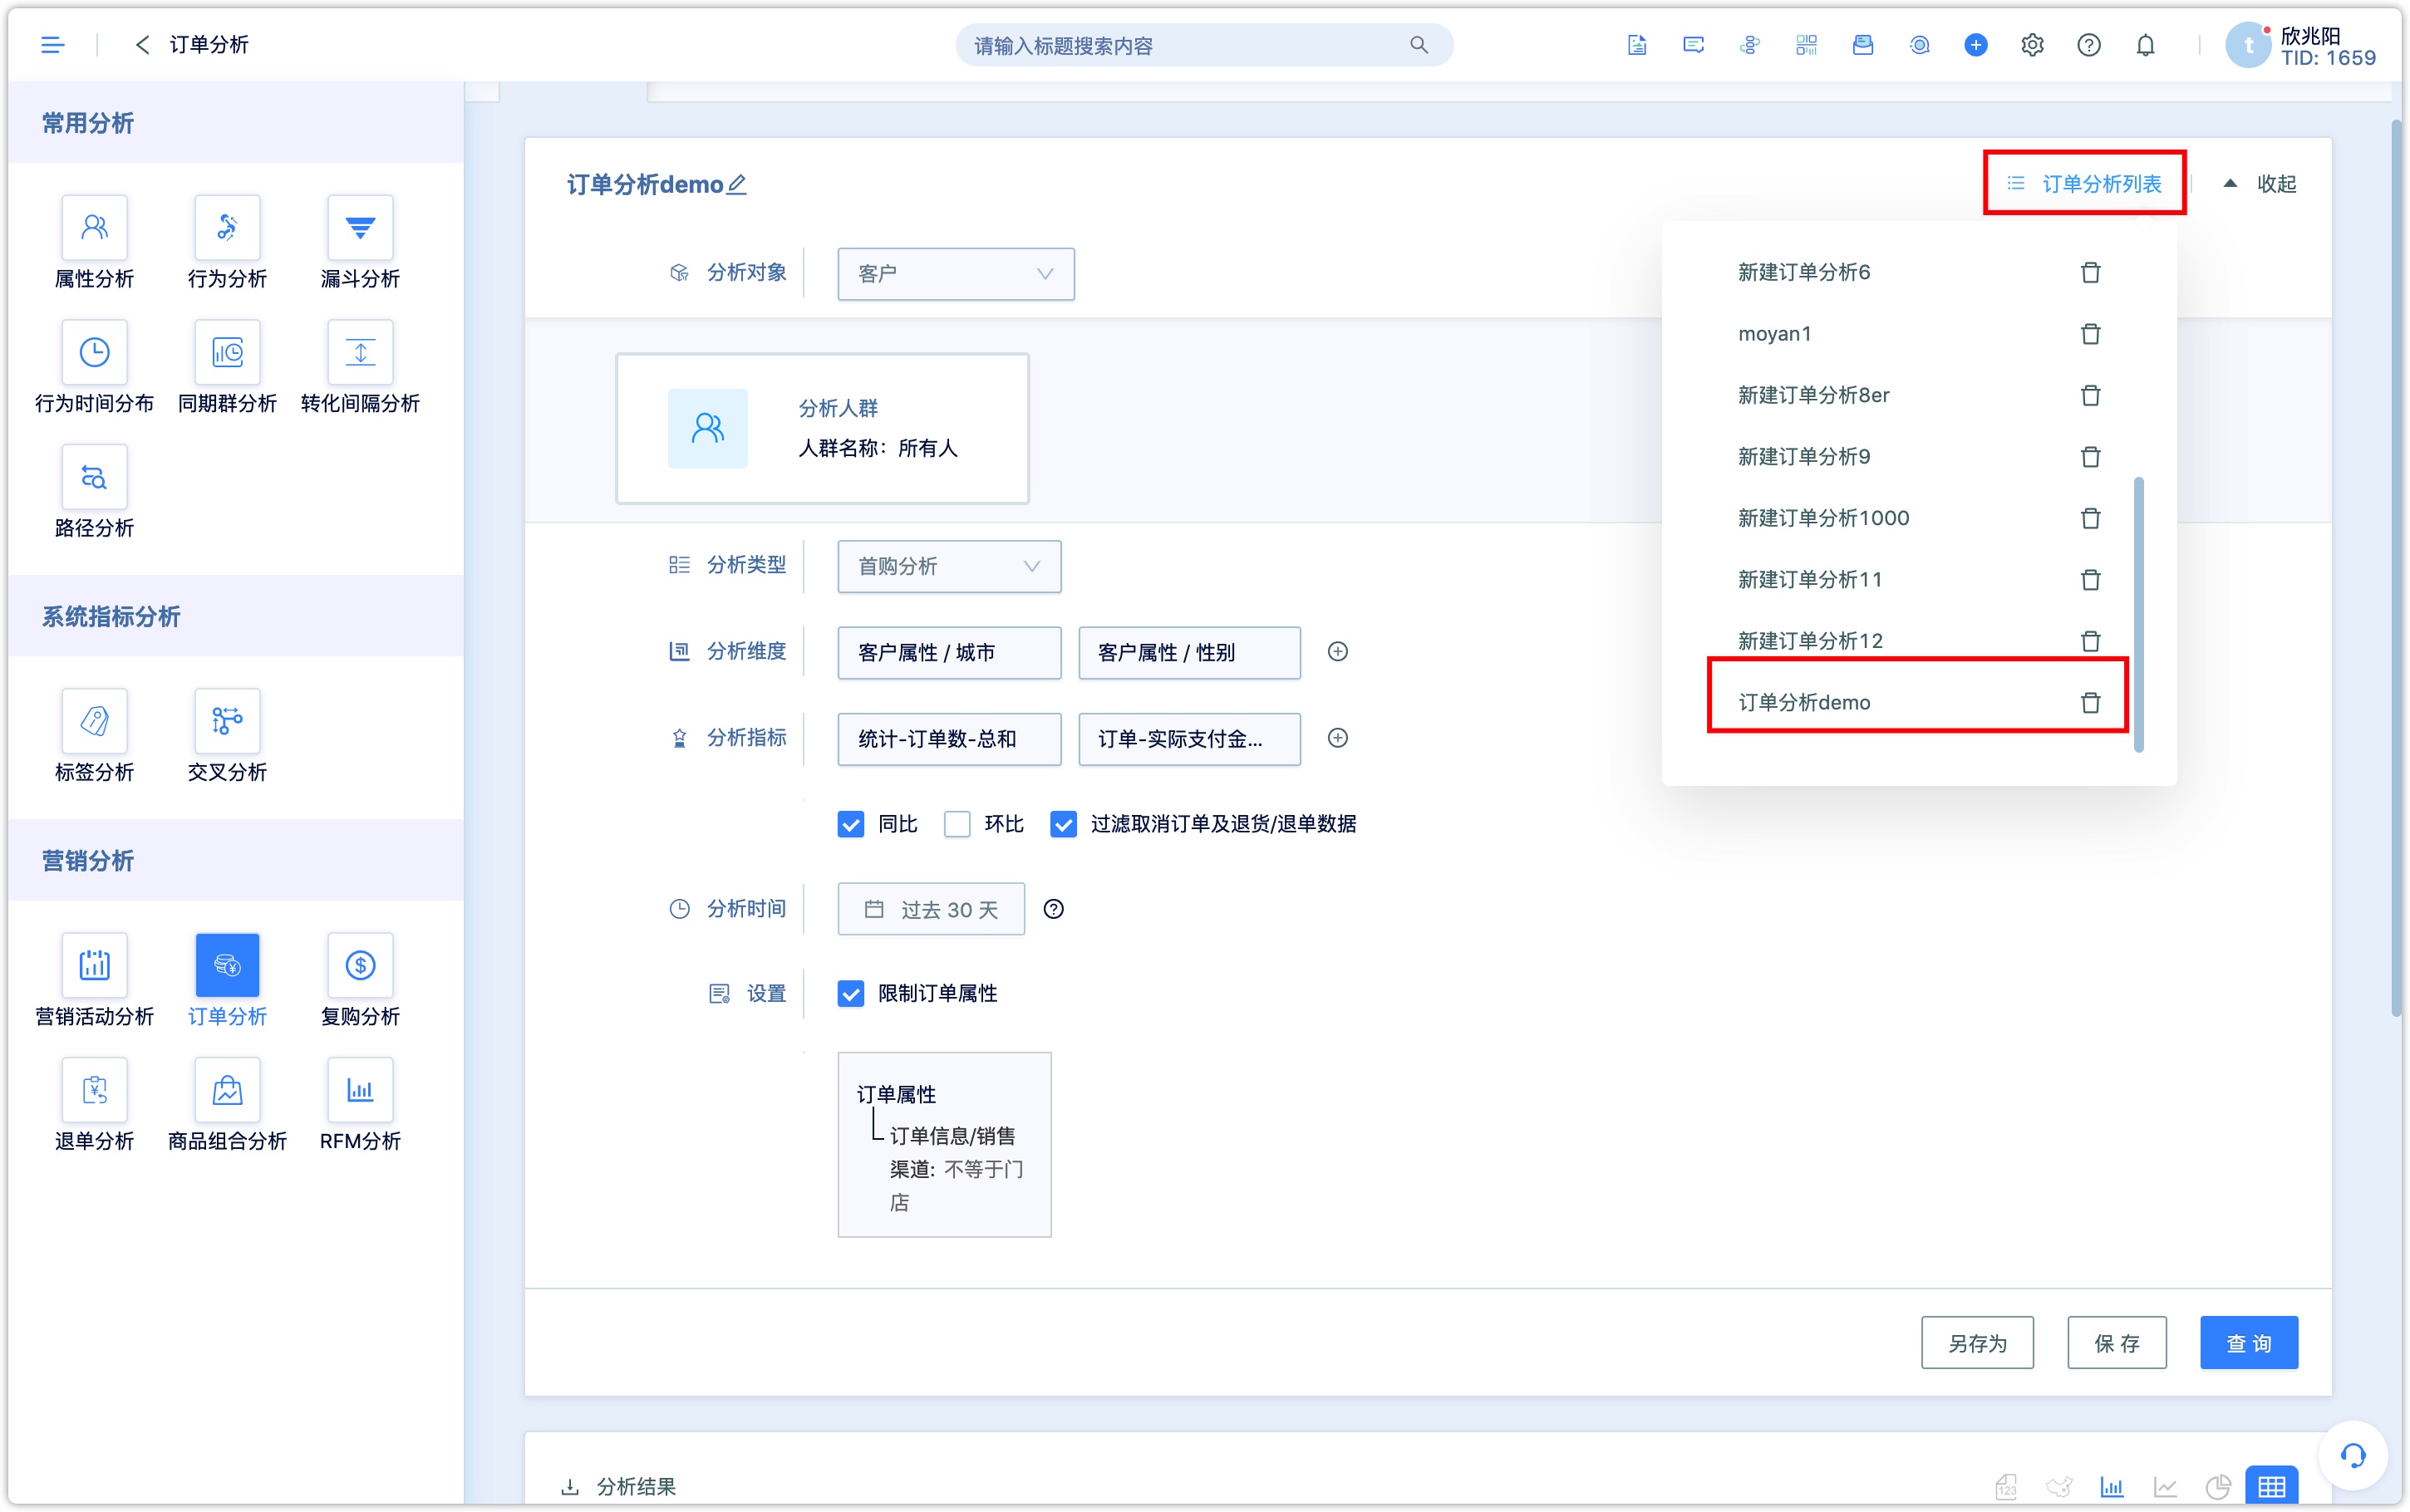
For example, analyze and compare data of following fans’ first purchases via online channels in the same periods, according to gender and city.

Among the fans currently following, the number of orders for men and women who completed the first purchase via online channels (non-offline stores) in the past 30 days is 1, and the actual total payment is 0.01 respectively, compared with the same period last year, the number of orders and payment amount are both is 100%.
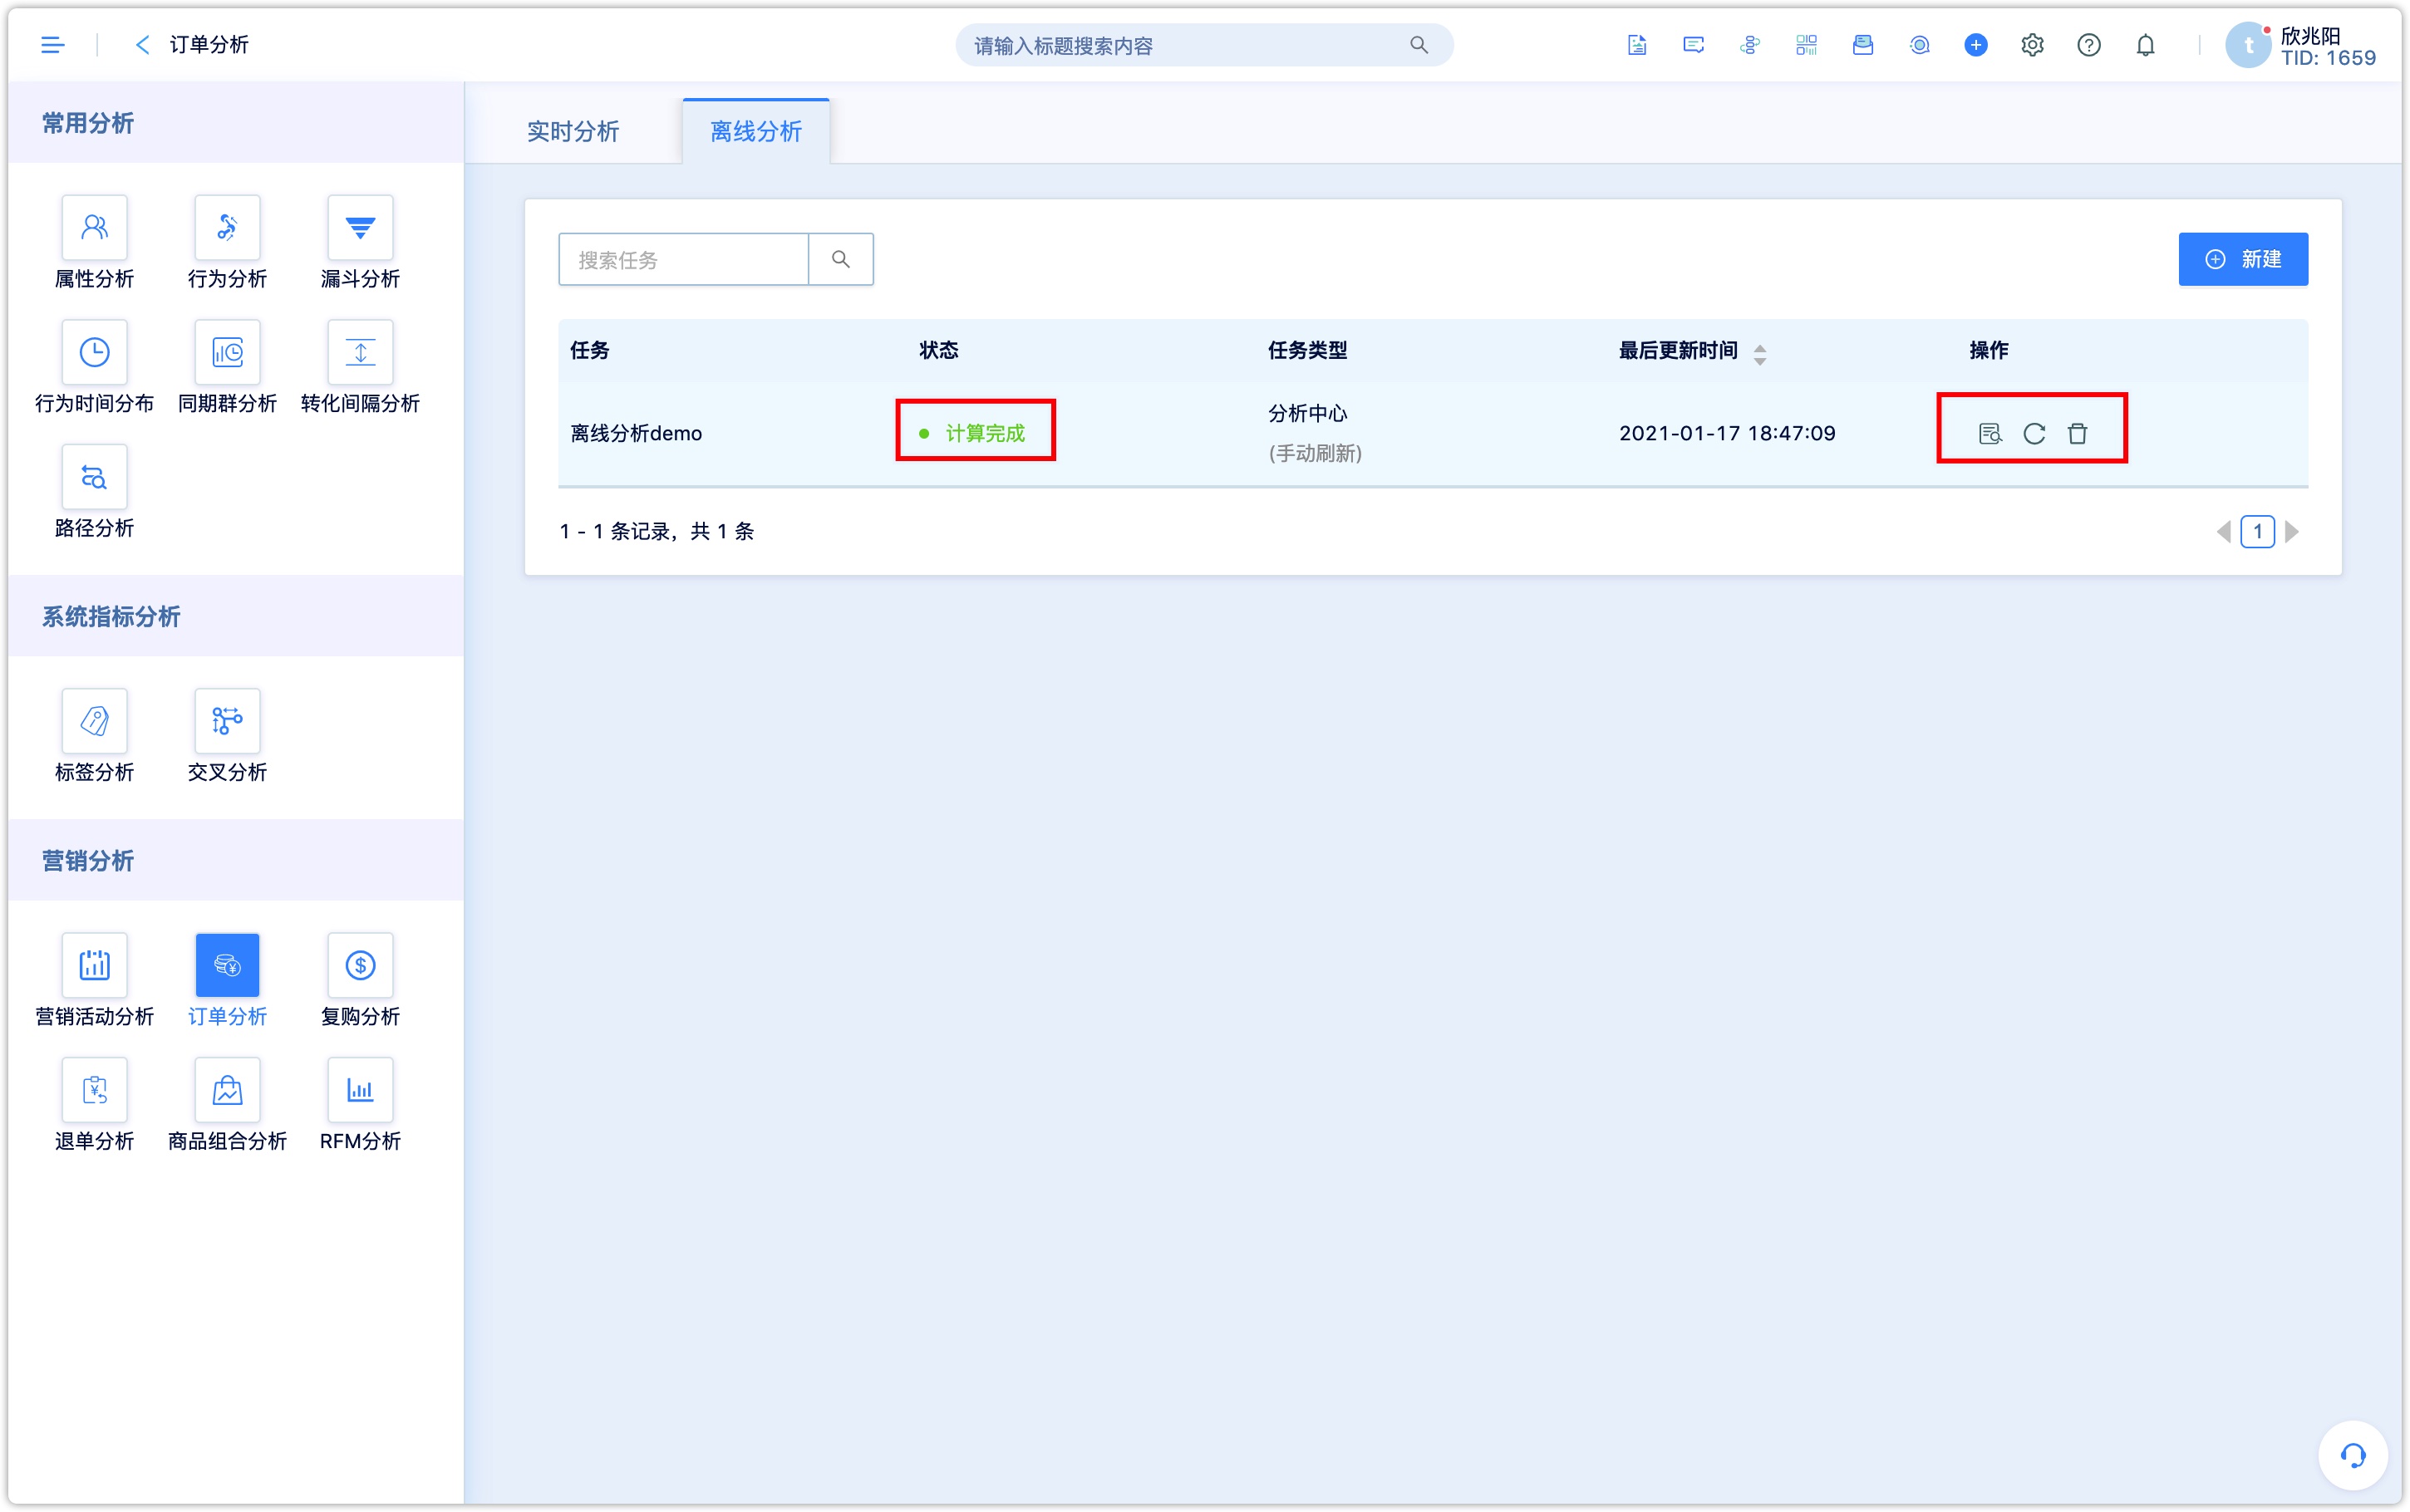
5.Offline analysis
Create an offline analysis, the condition setting is the same as real-time analysis
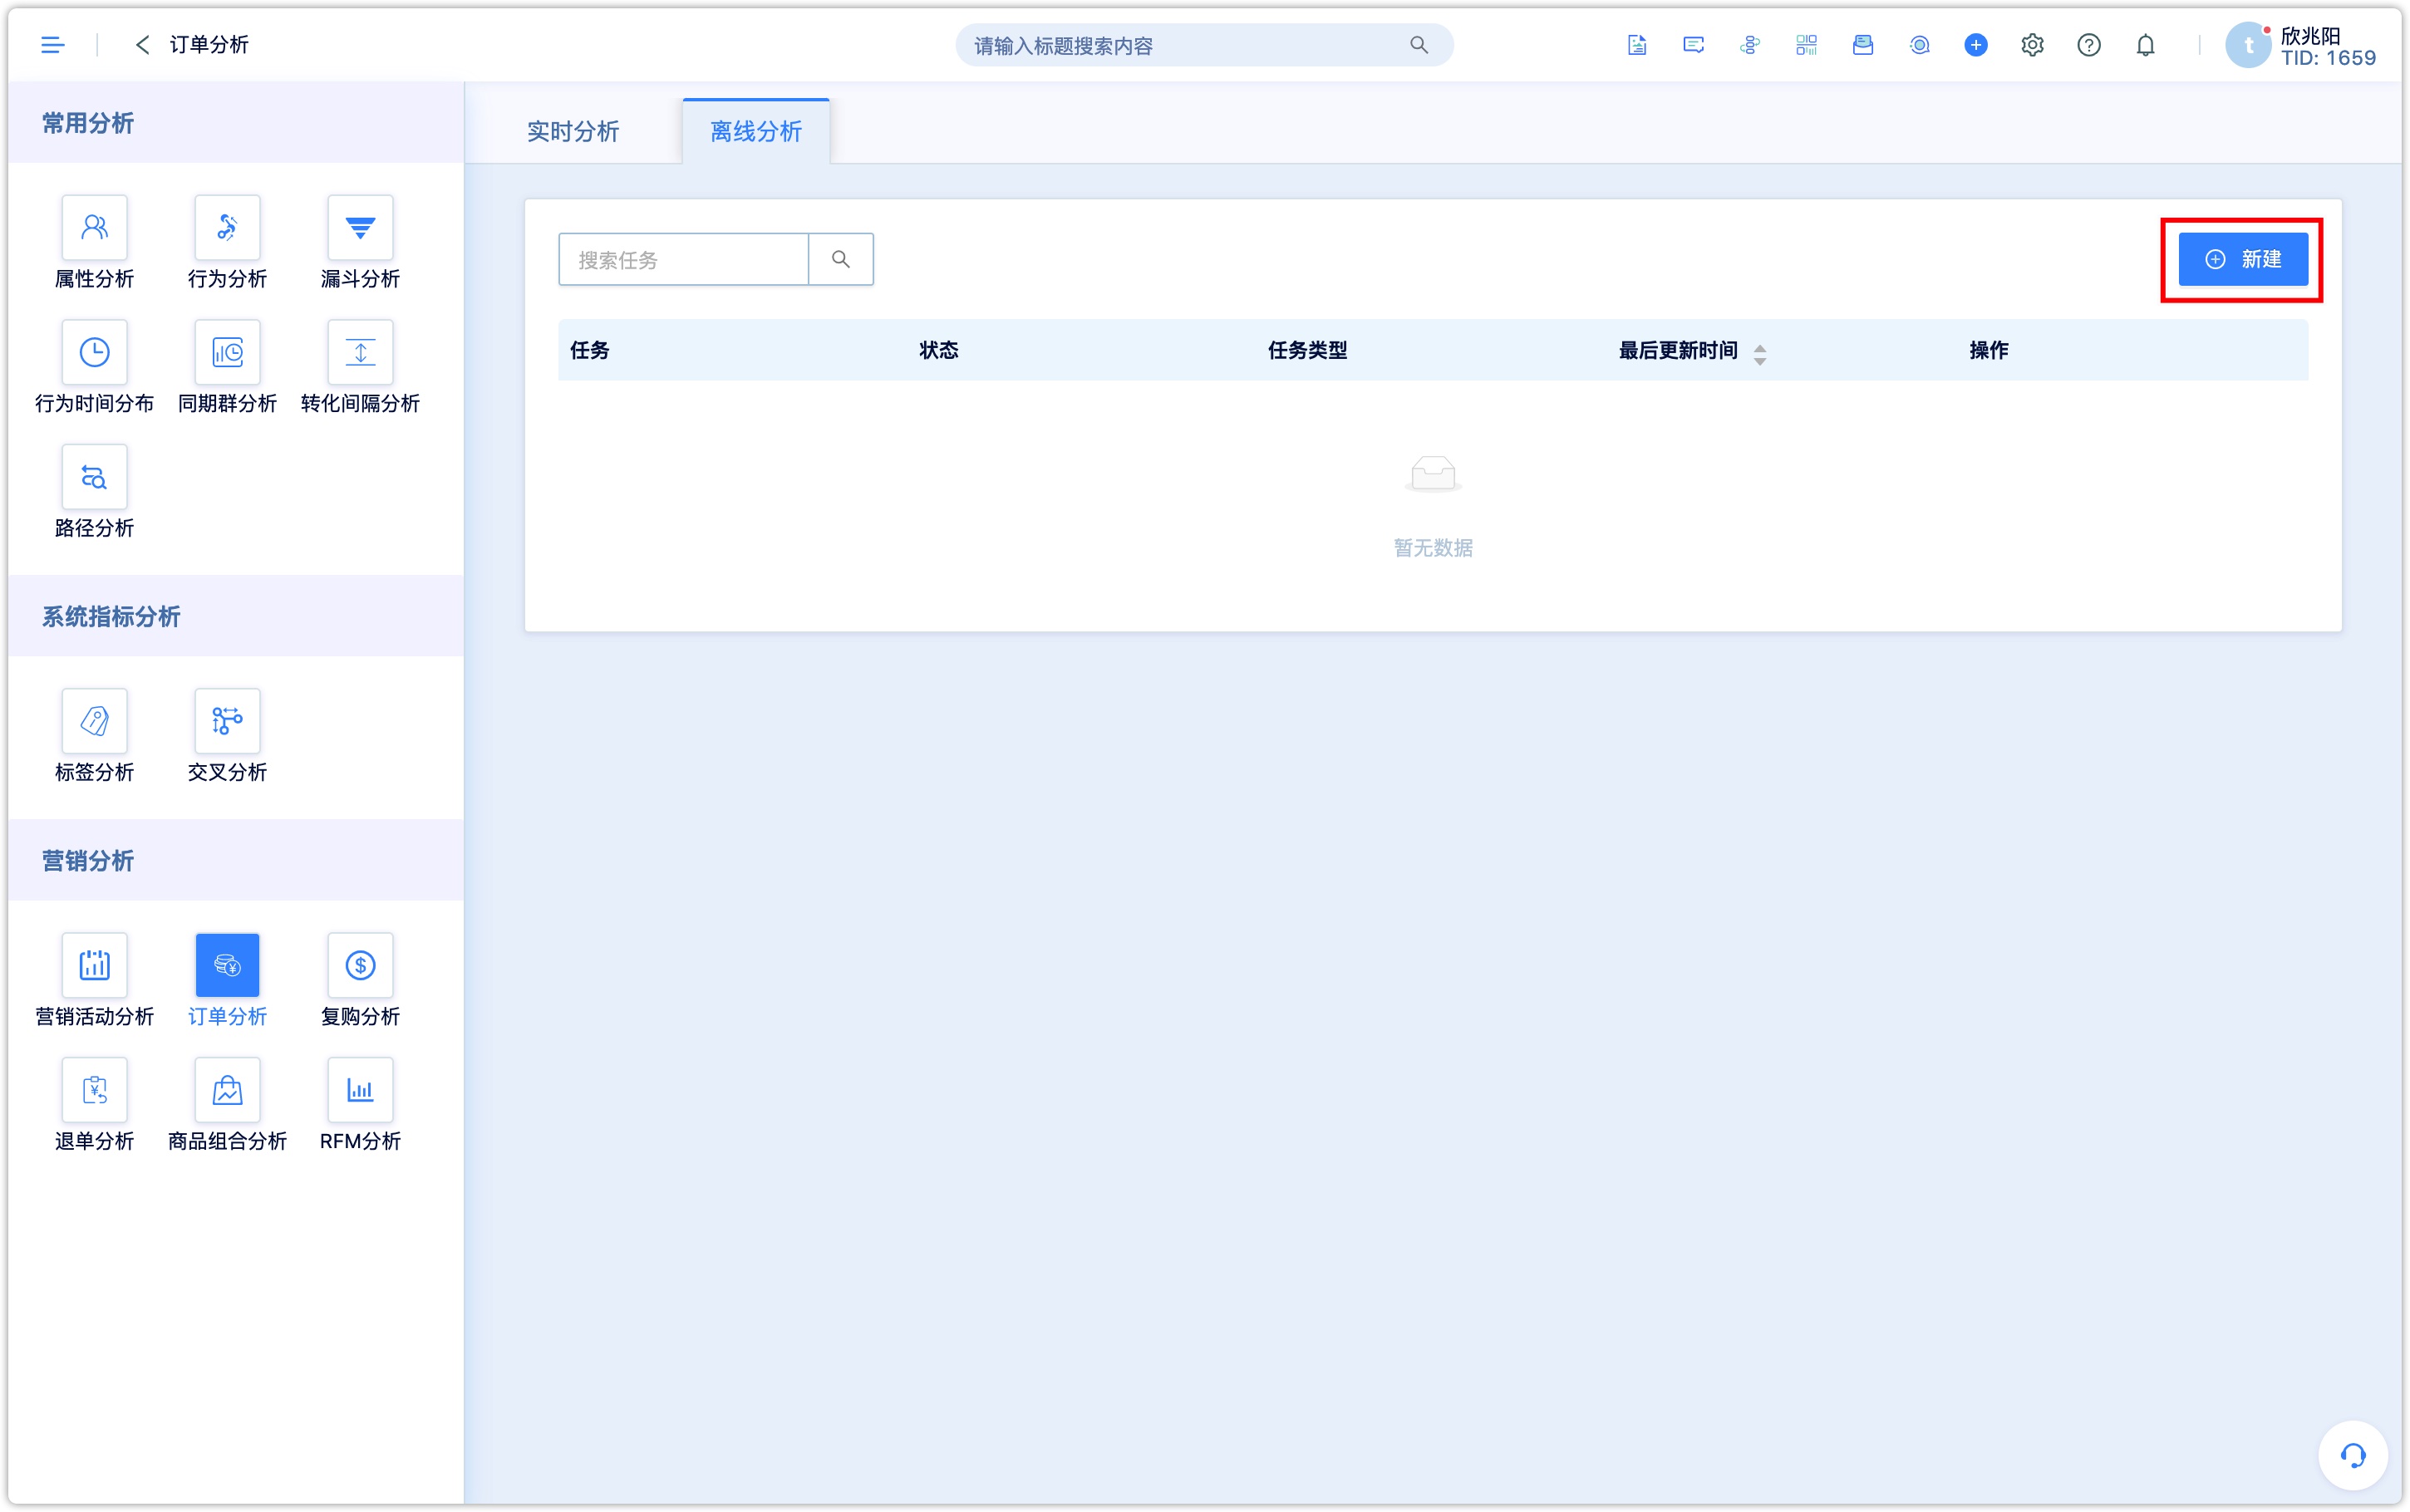
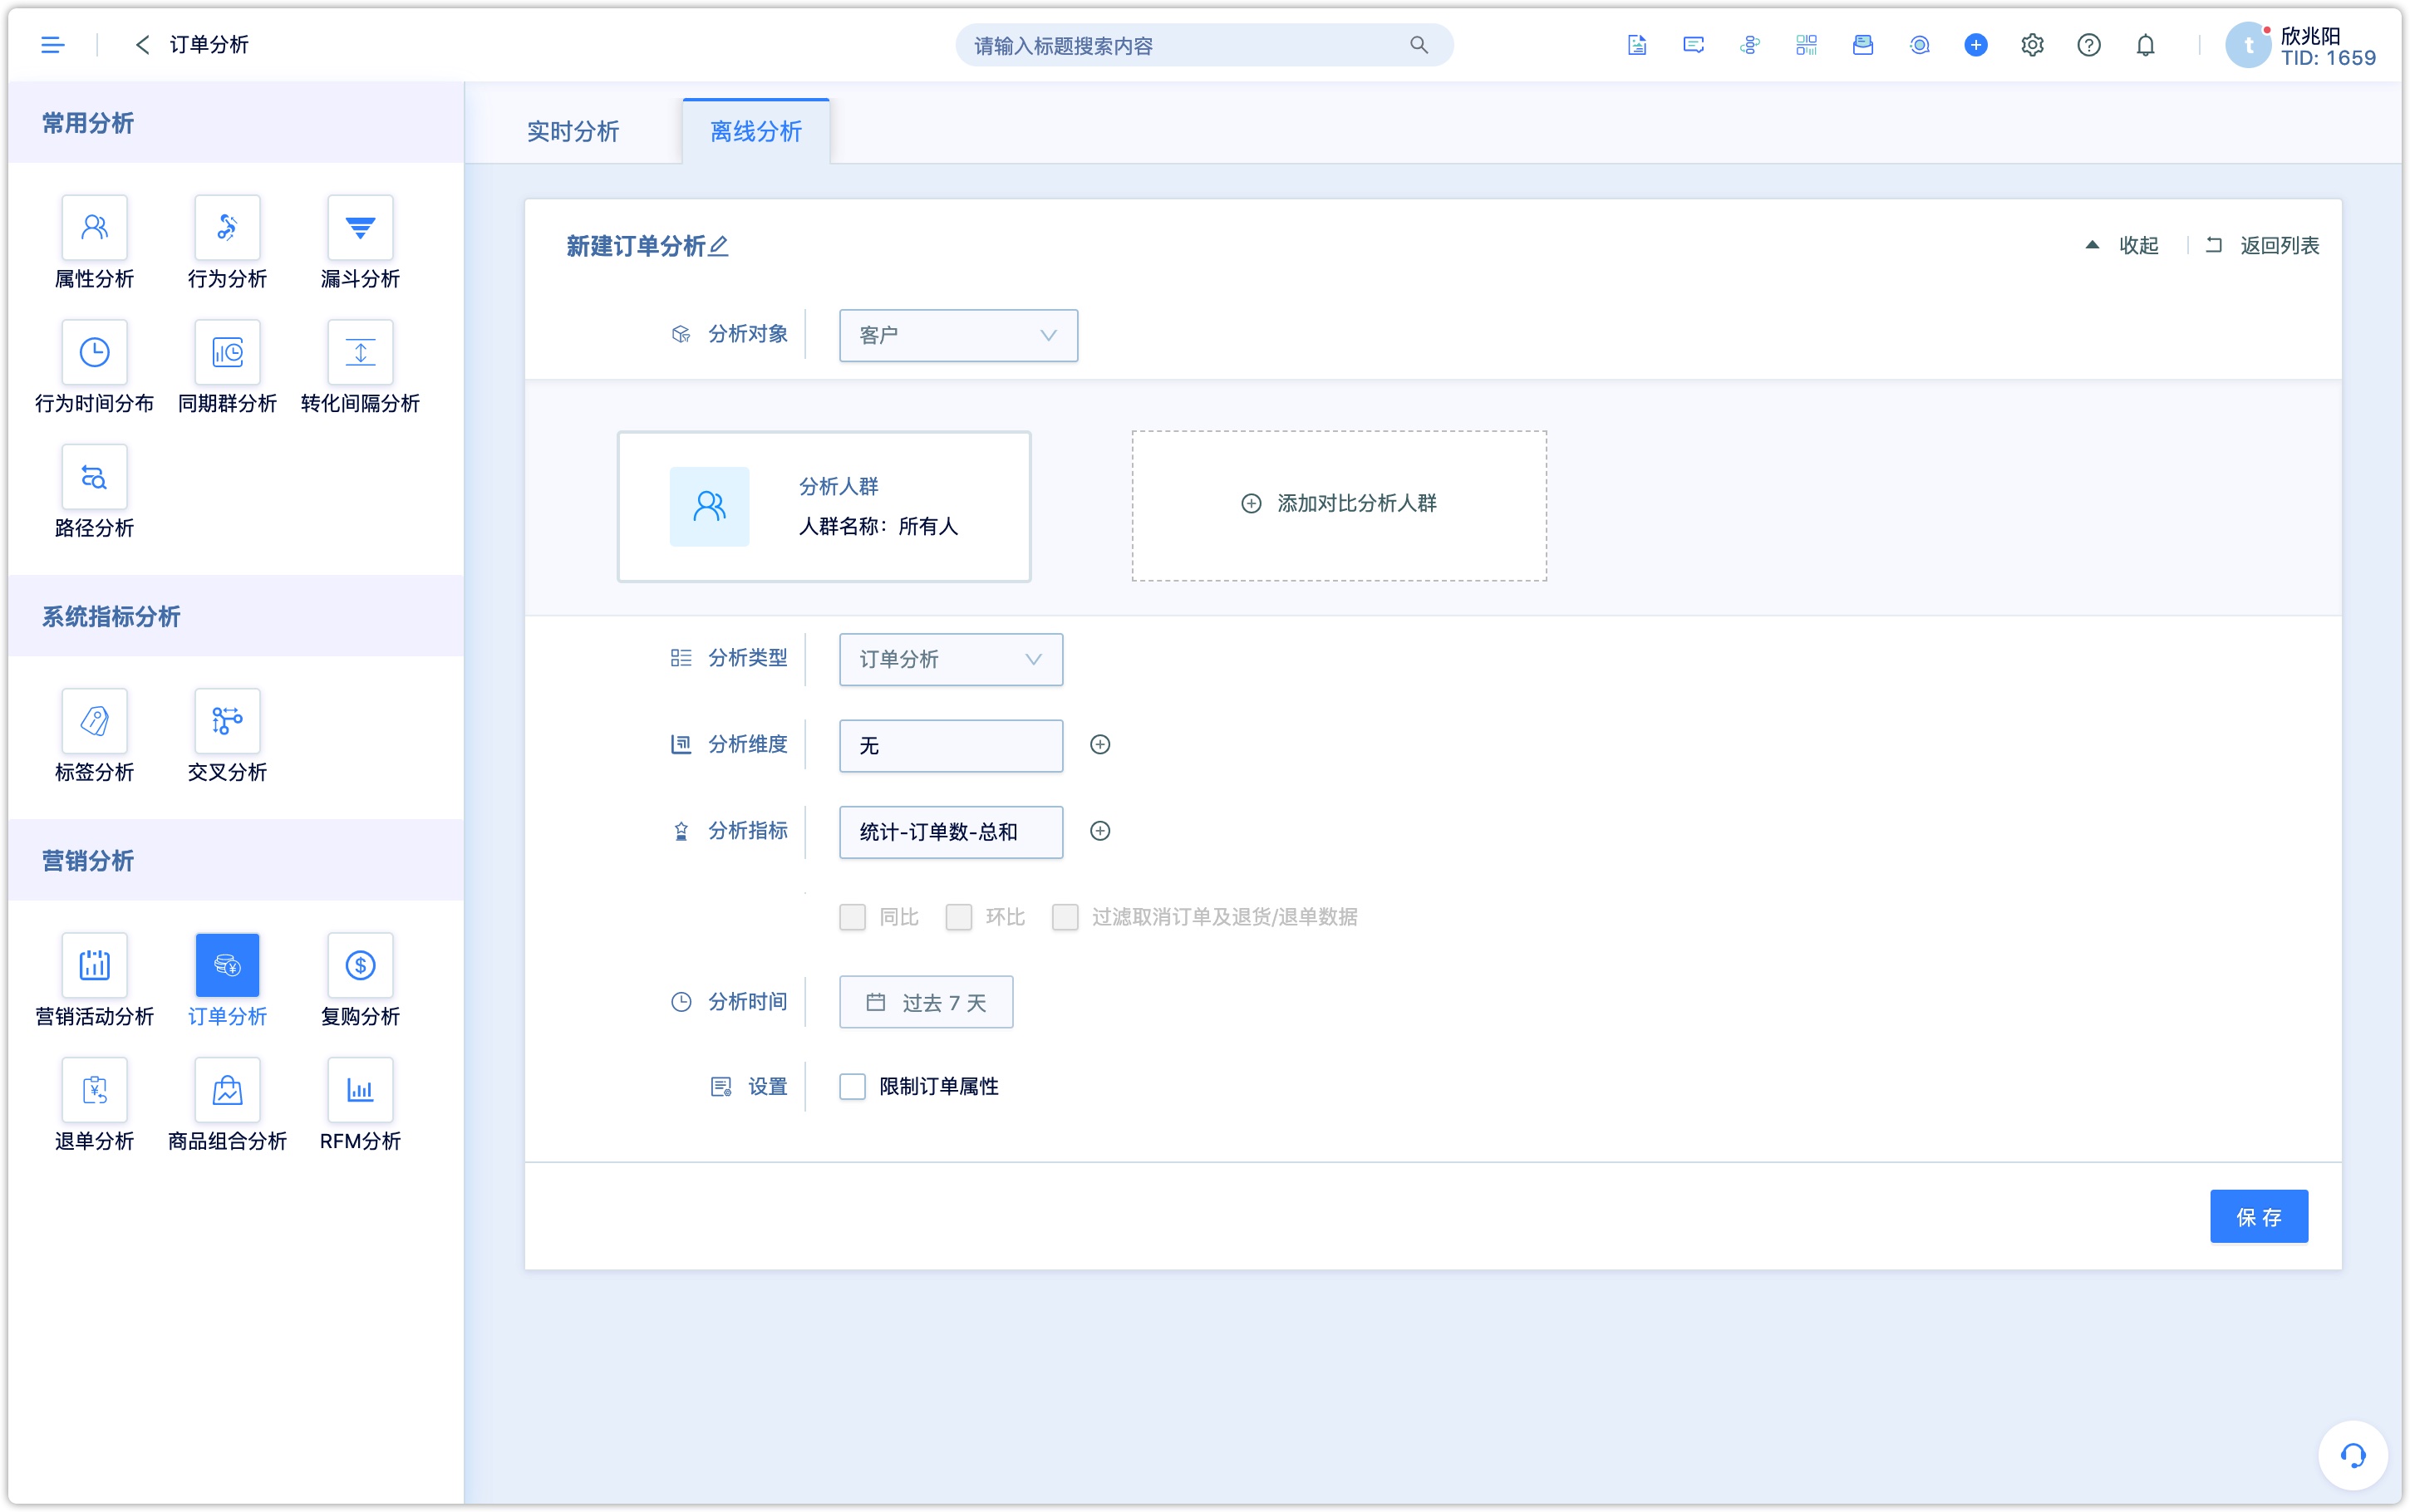
Refer to the setting introduction of real-time analysis and the analysis component and click query.
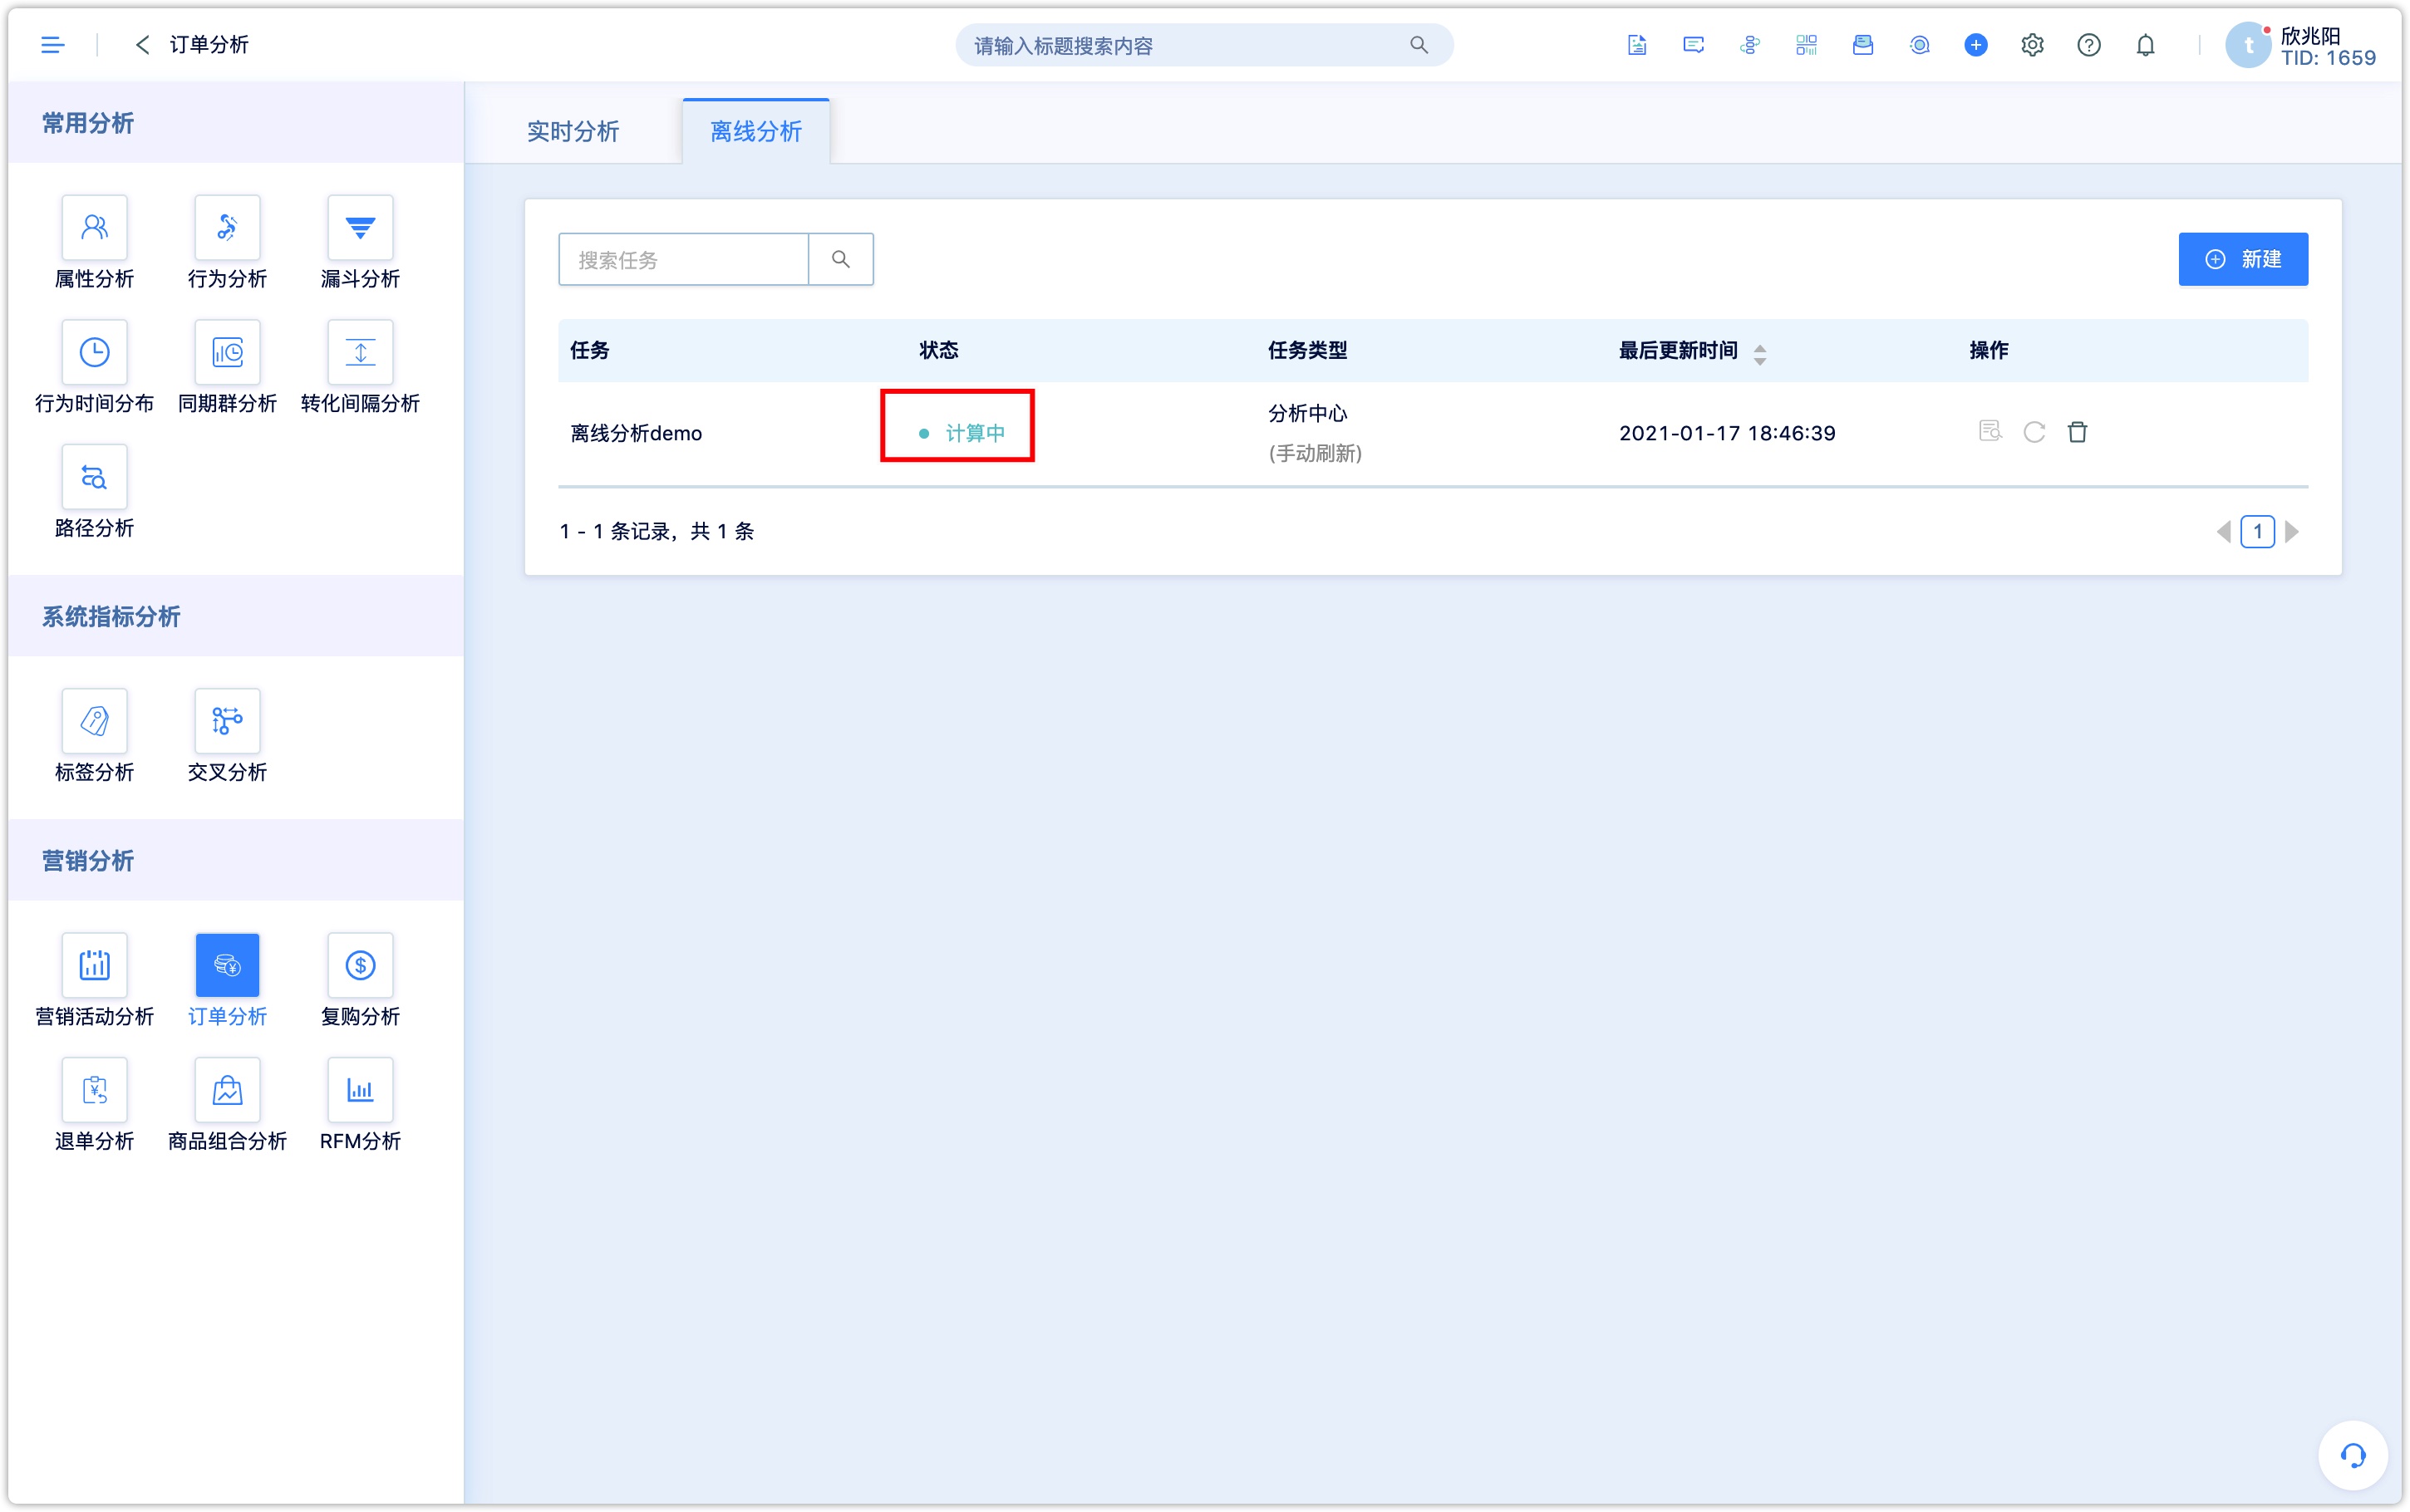
When the status is calculating, please wait patiently. After the calculation is completed, you can view the component details. You can refresh and recalculate manually, as well.