marketing campaign analysis
1.Overview
Campaign analysis is a series of analysis for the object of "campaign", aiming at analyzing the overall picture of the entire campaign. Before analyzing the campaign, please refer to " Description of Campaign " (link to be provided) to know more about the features of campaign.
2.Process instructions
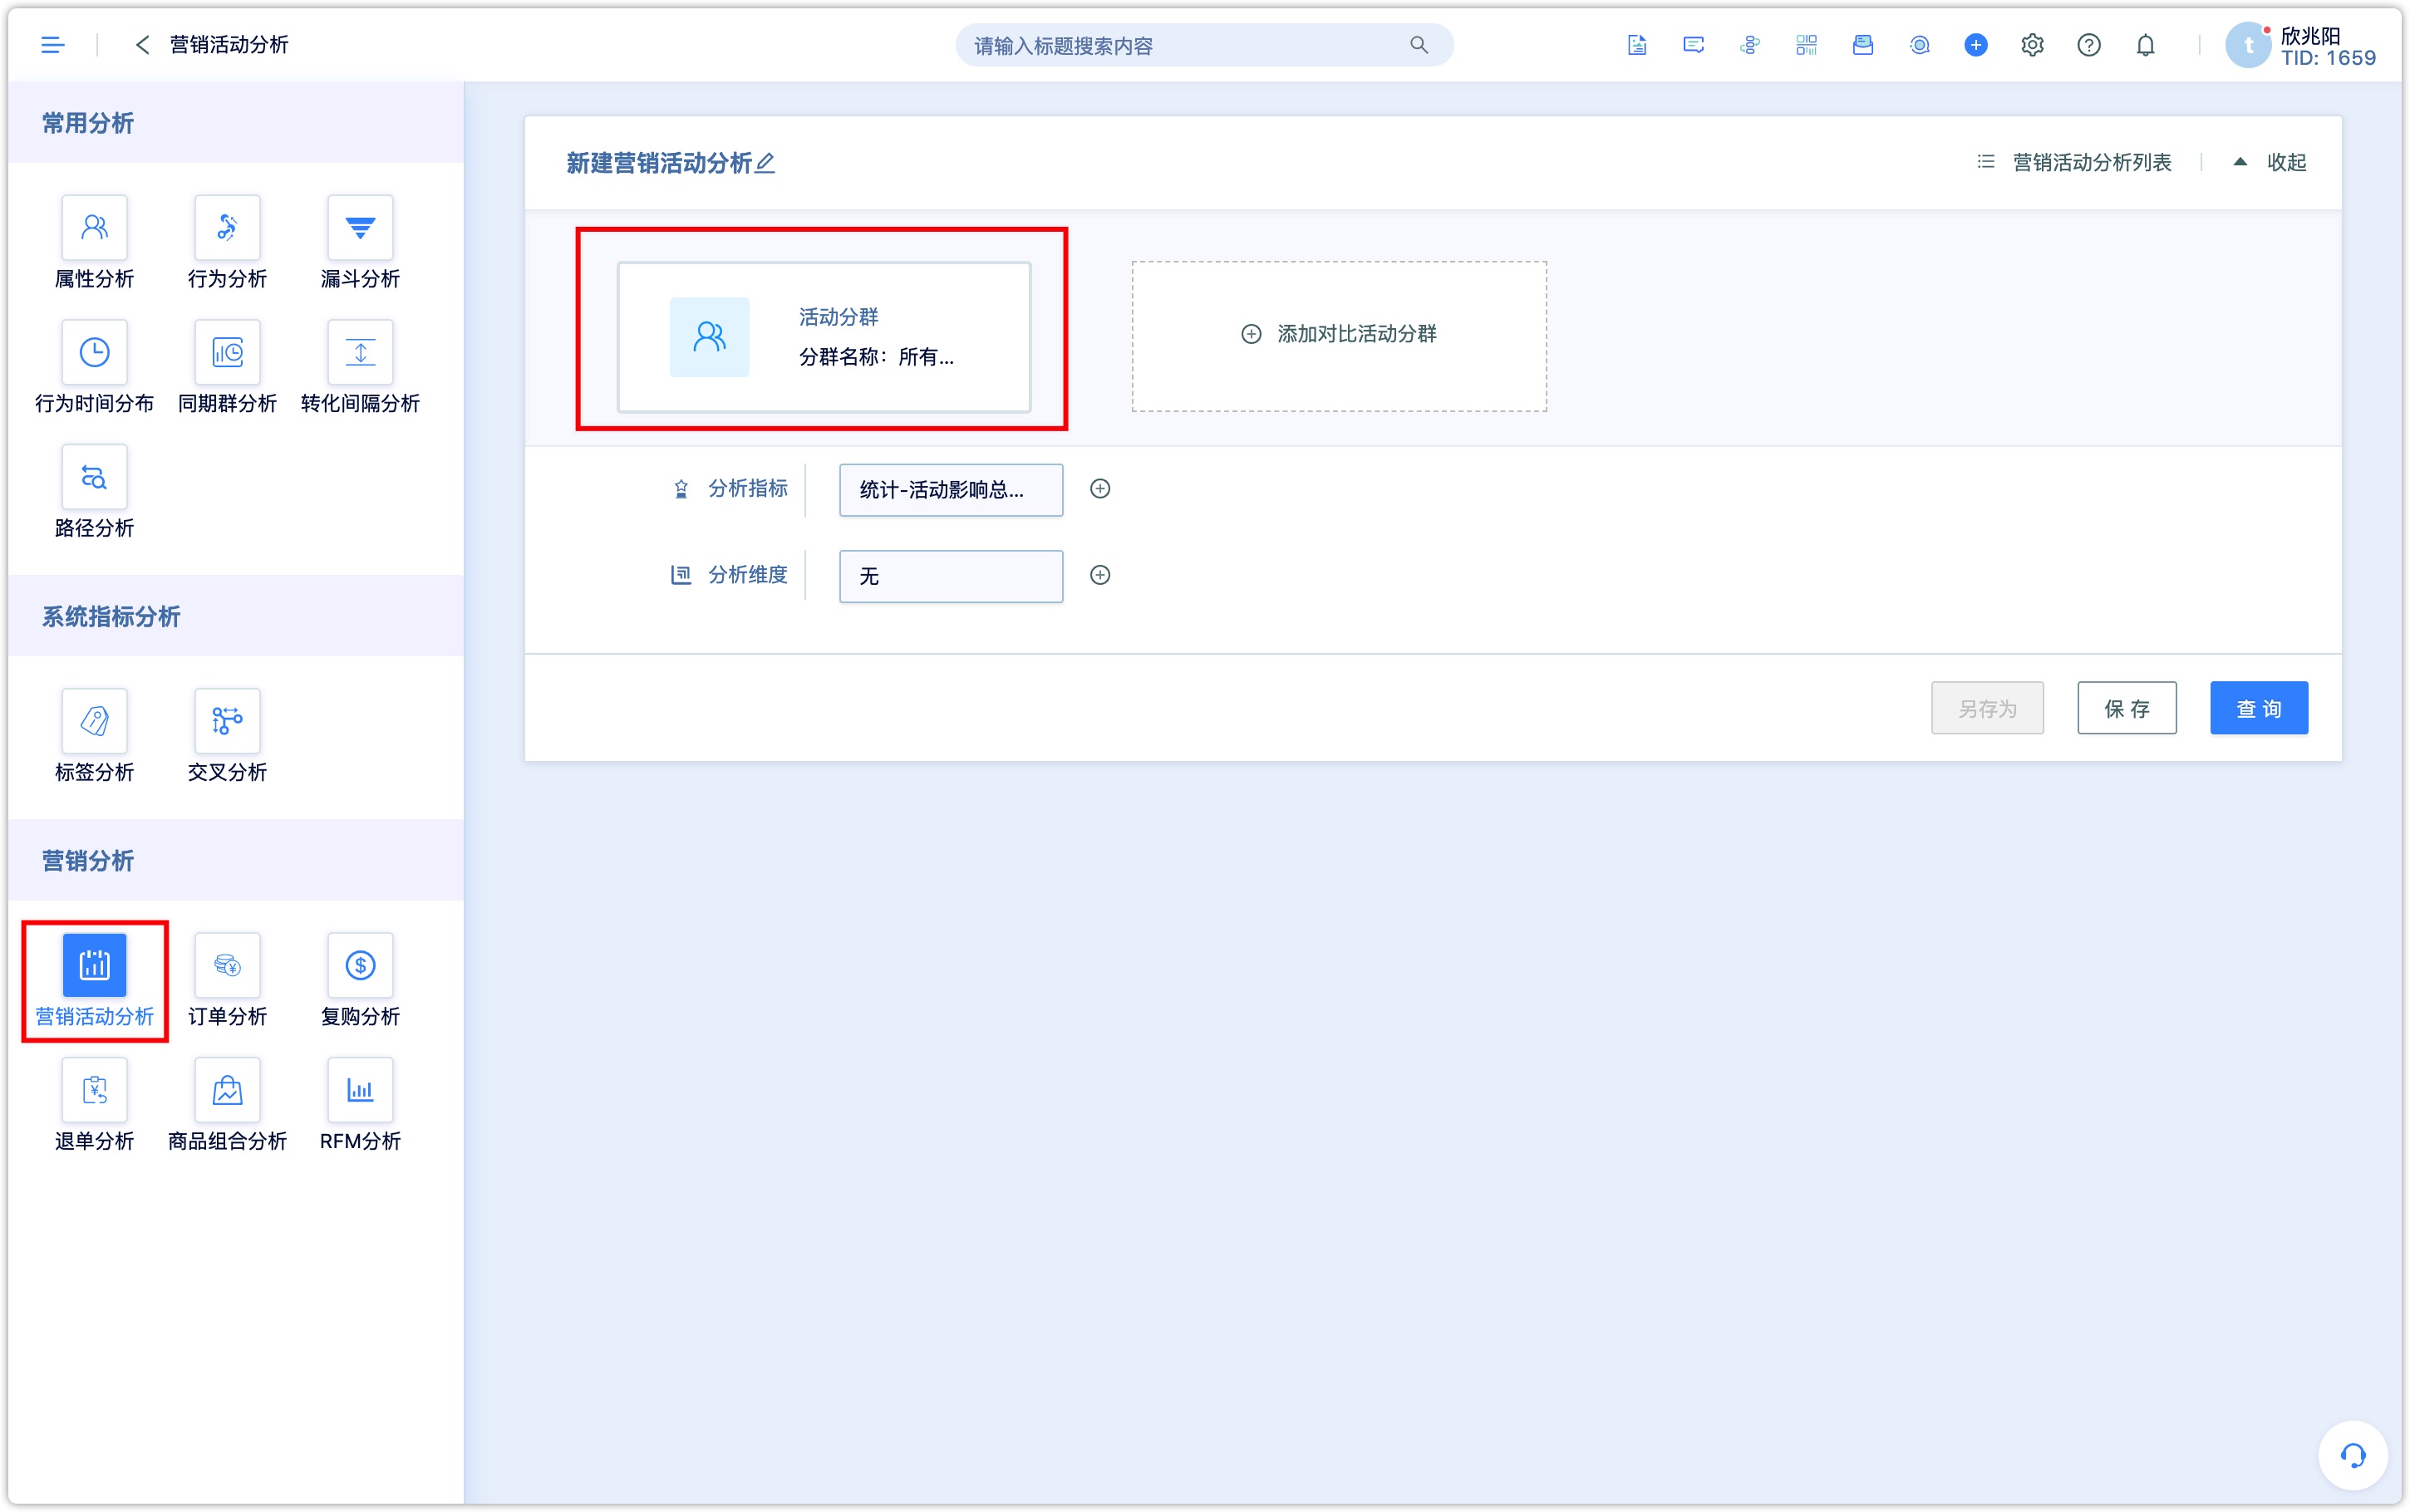
2.1Restrict participated group
2.1.1Single participated group
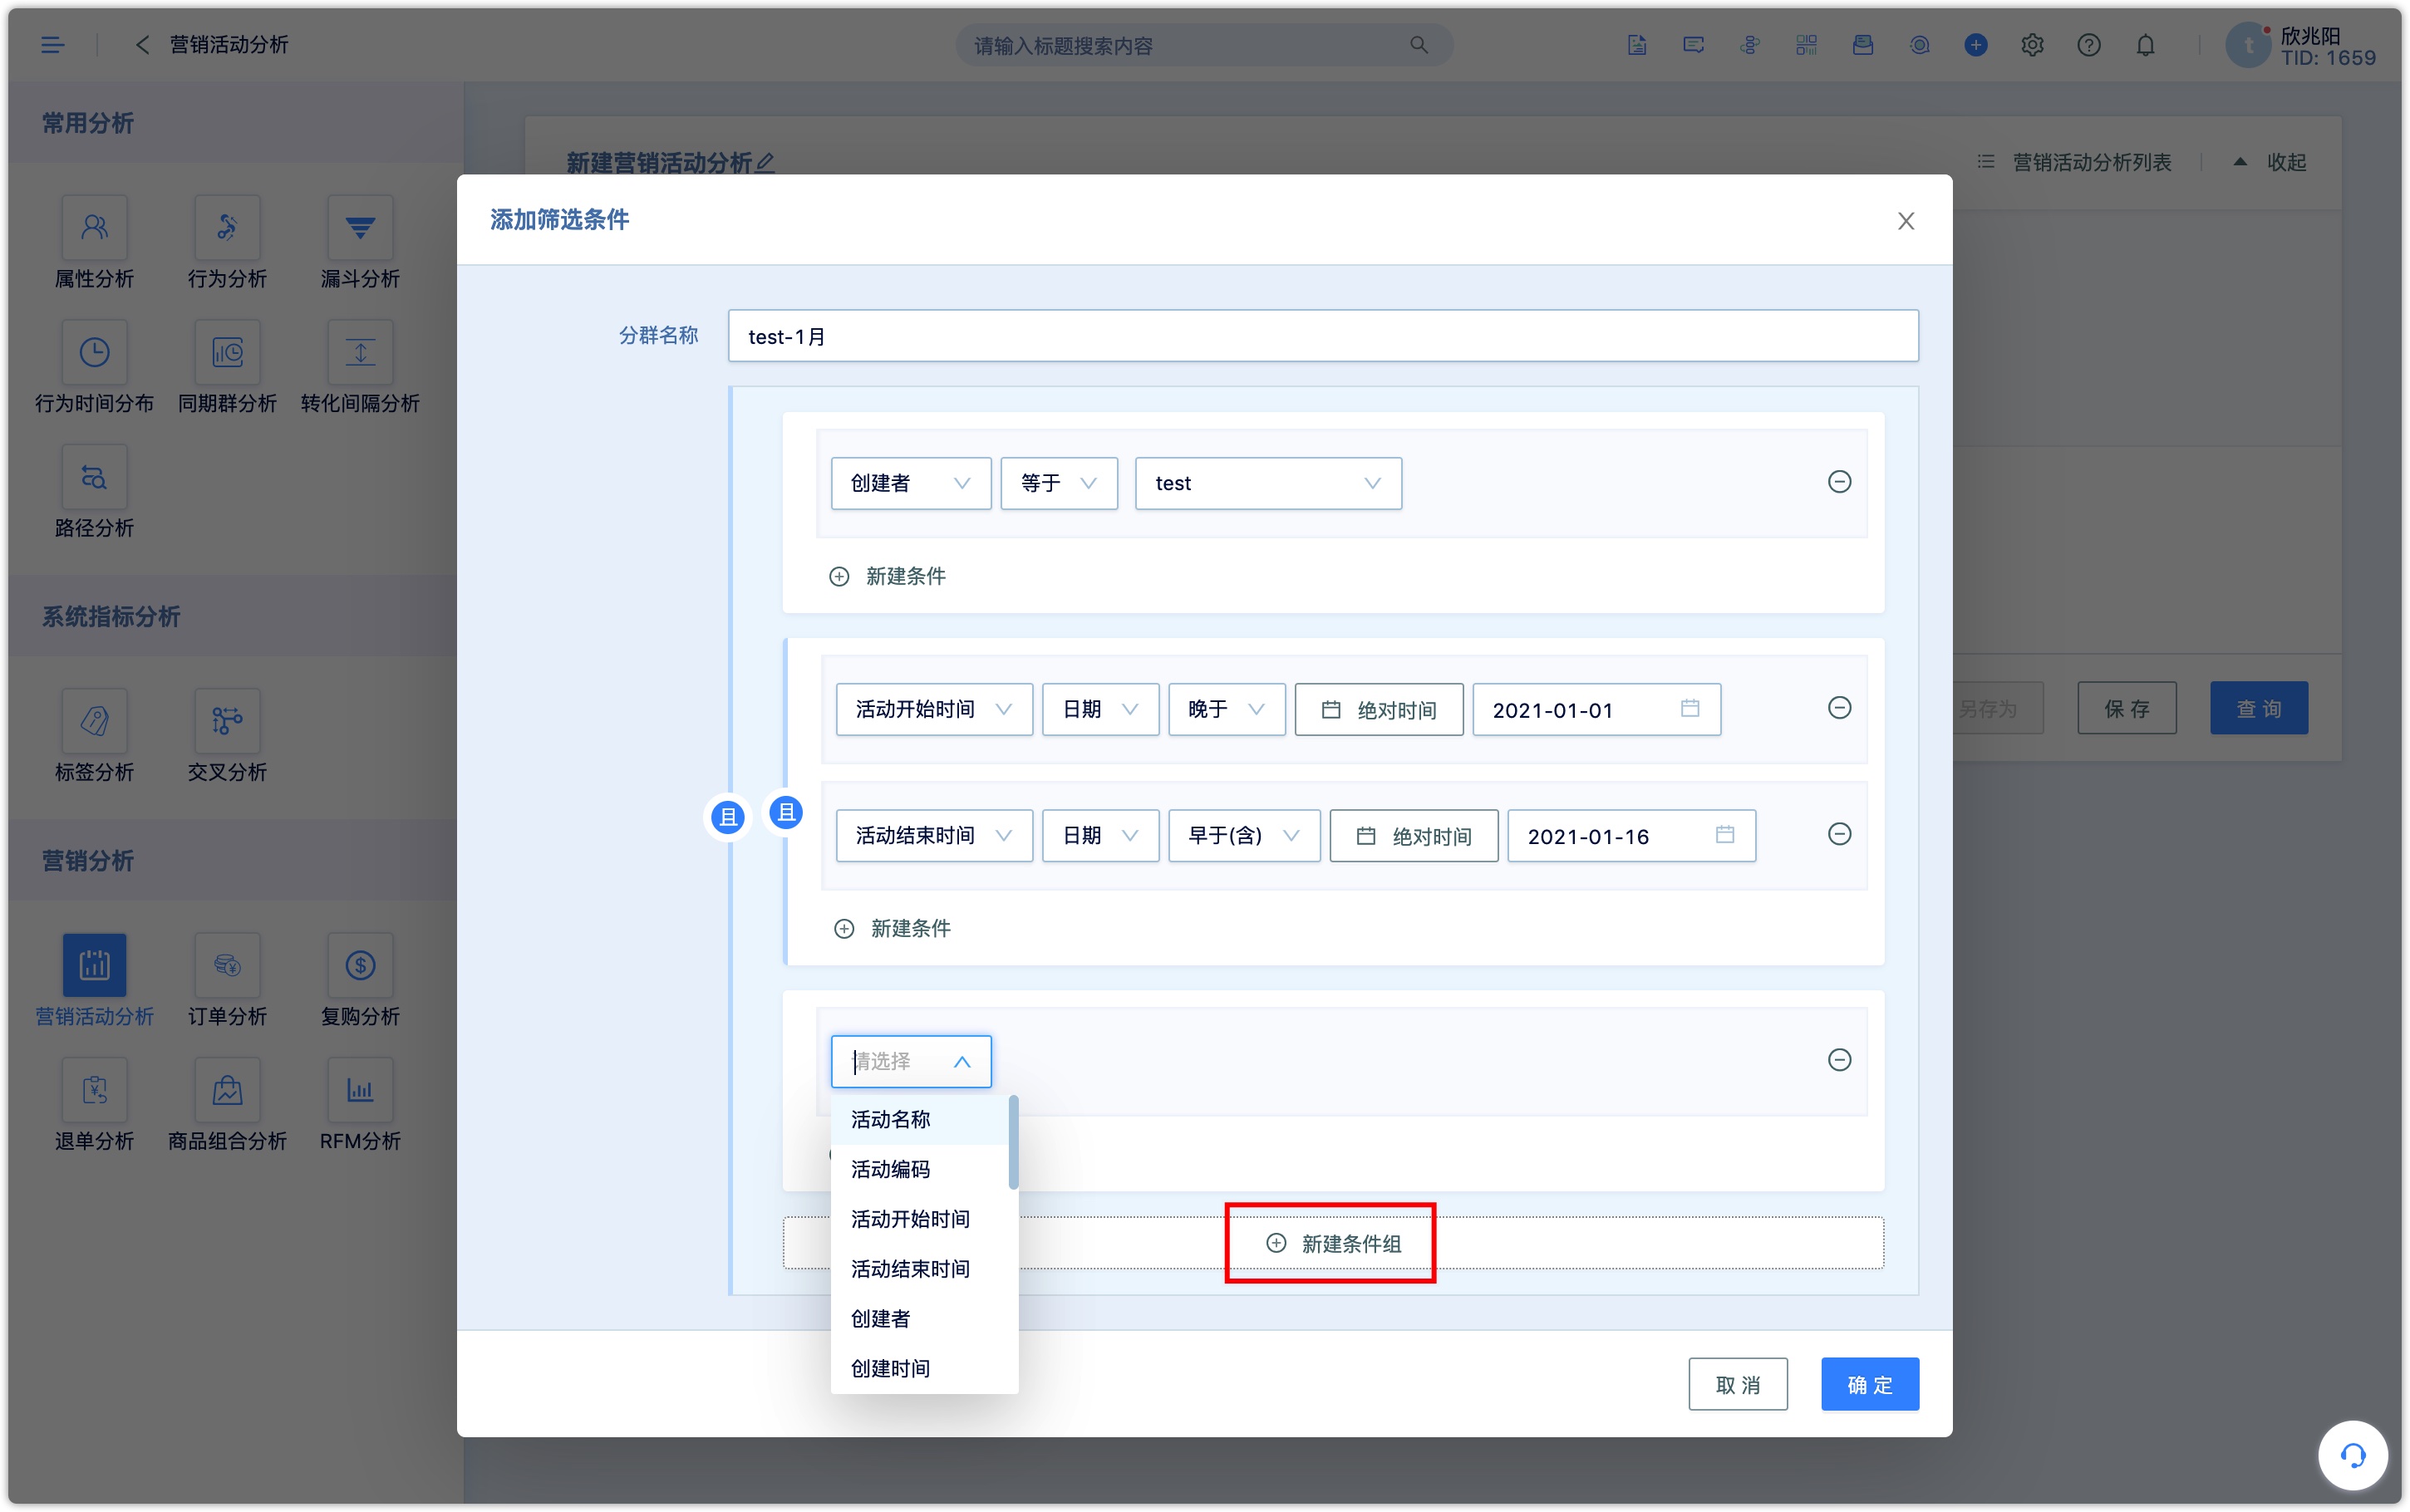
By restricting the requirements of the participated group, the campaign scope can be limited.
For example, demonstrated as follows, the campaign scope is restricted by the conditions:
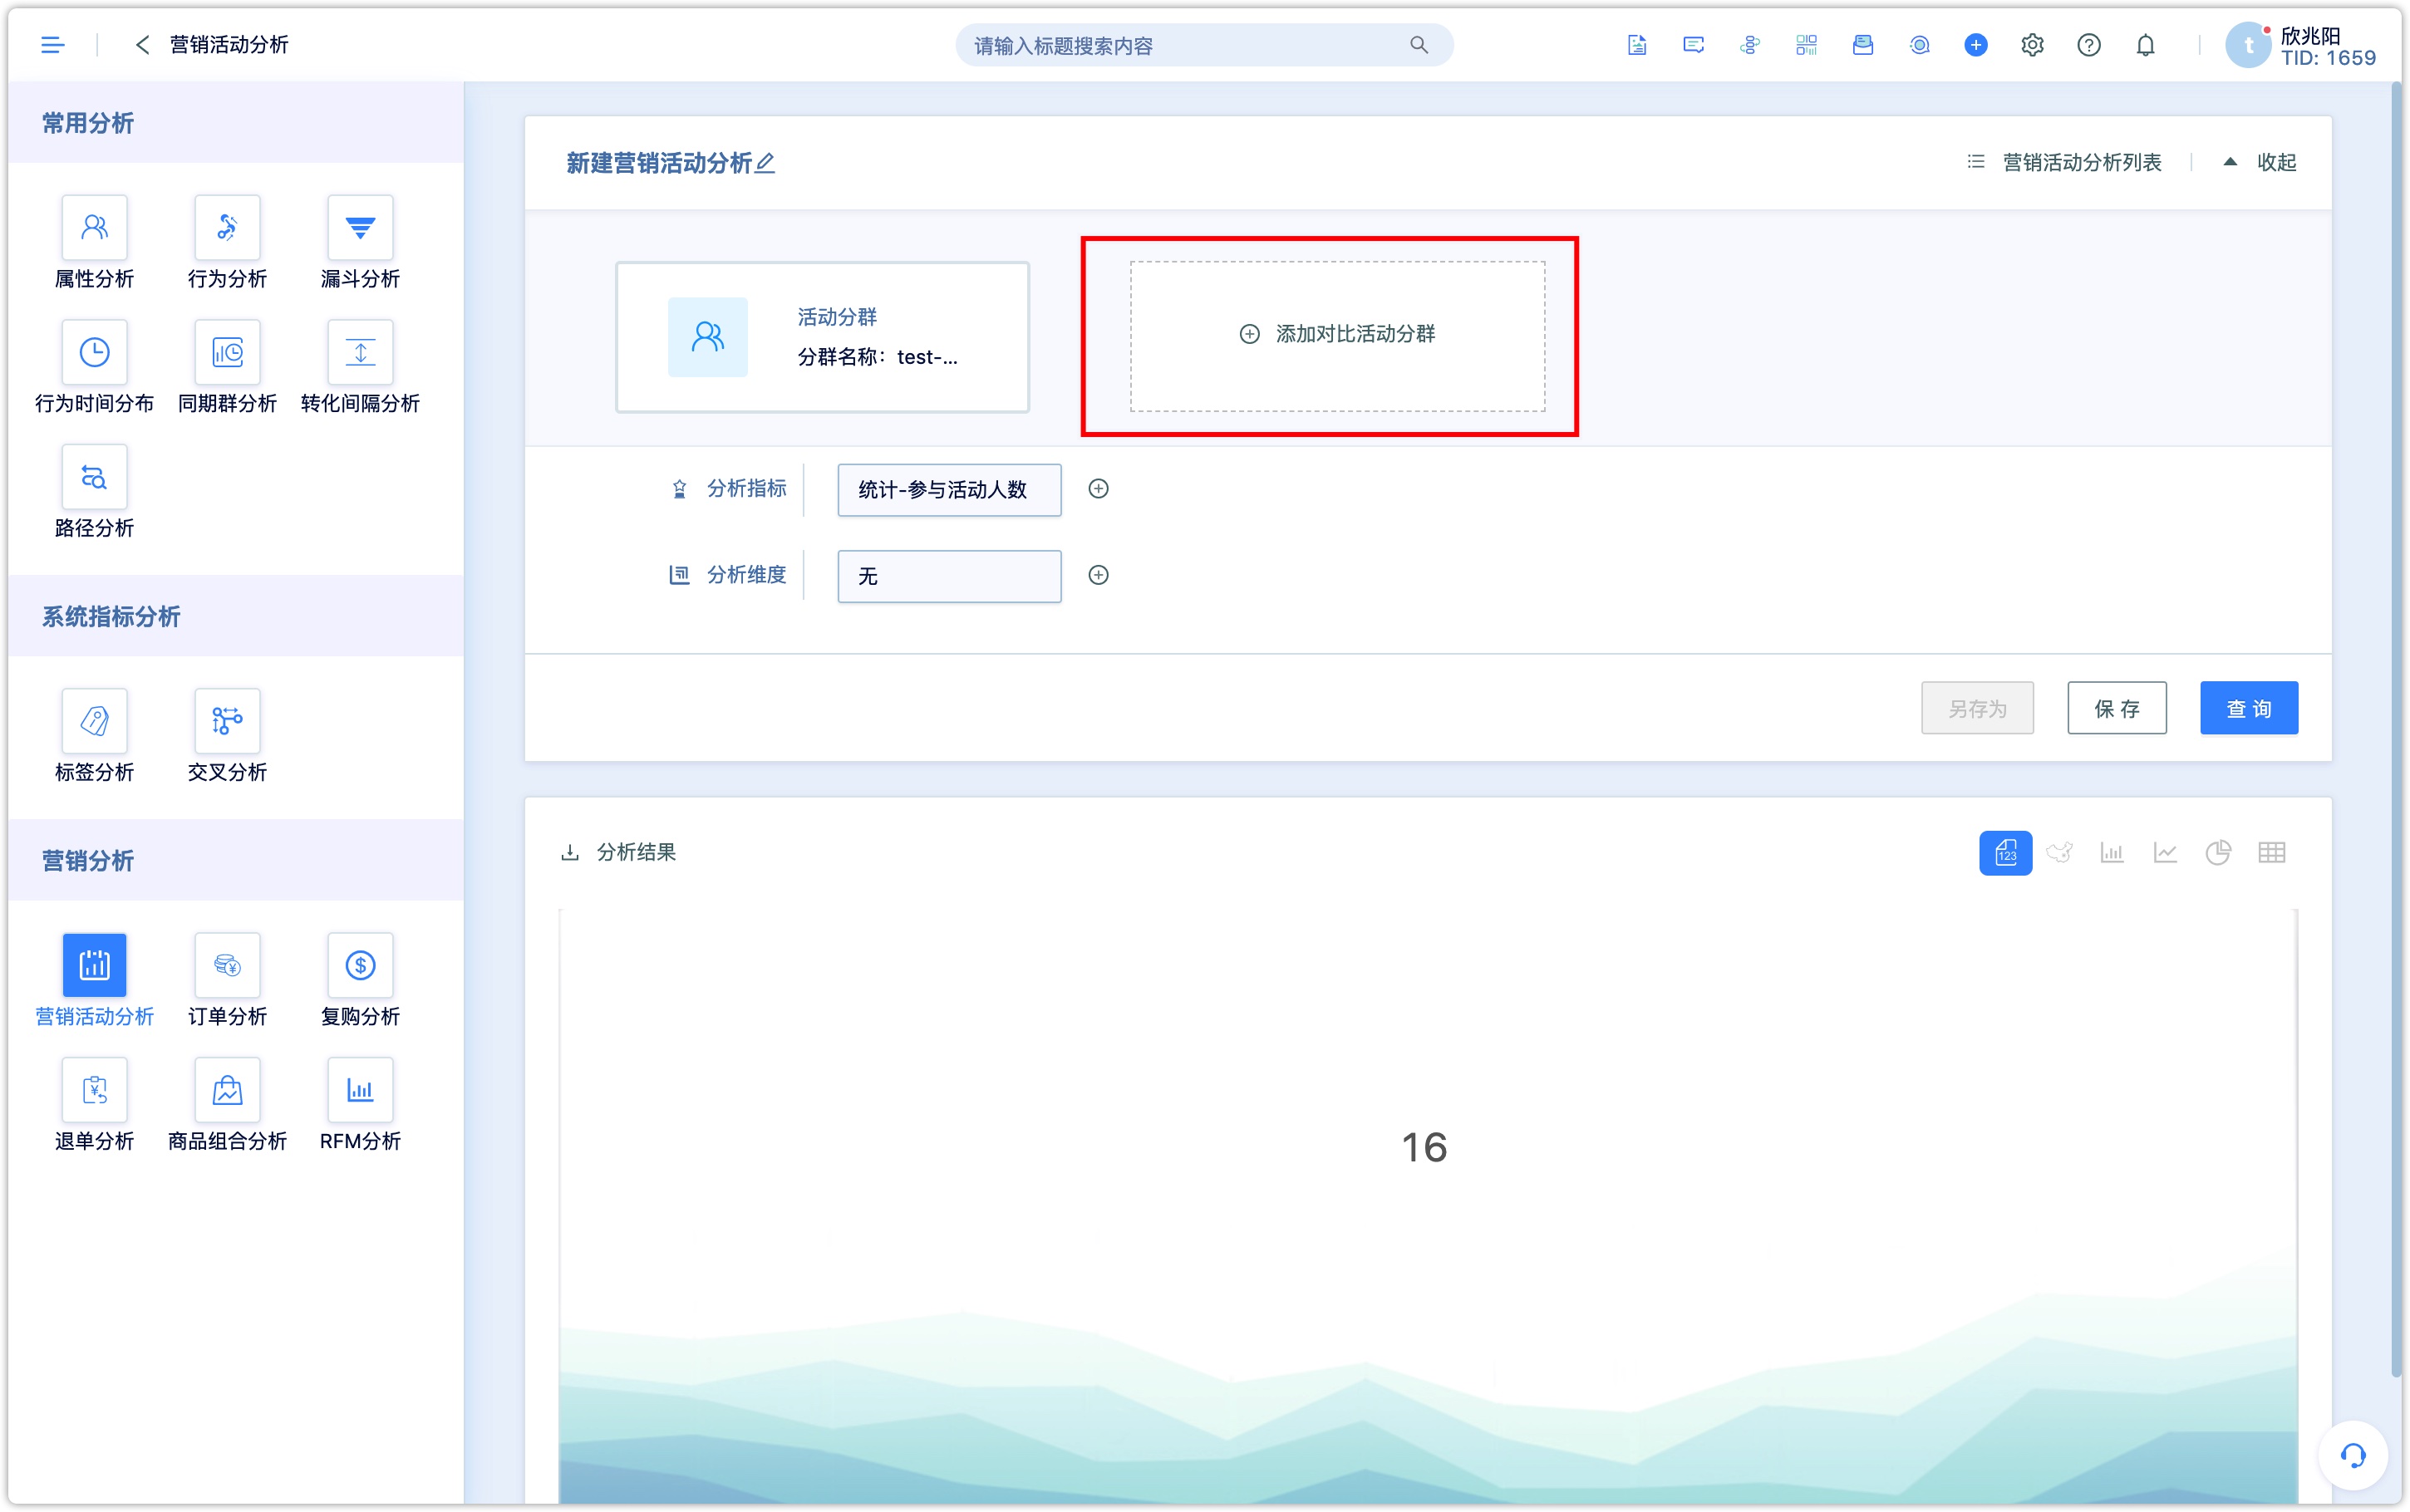
2.1.2Comparison group
Comparison group is to compare the data of the two groups.
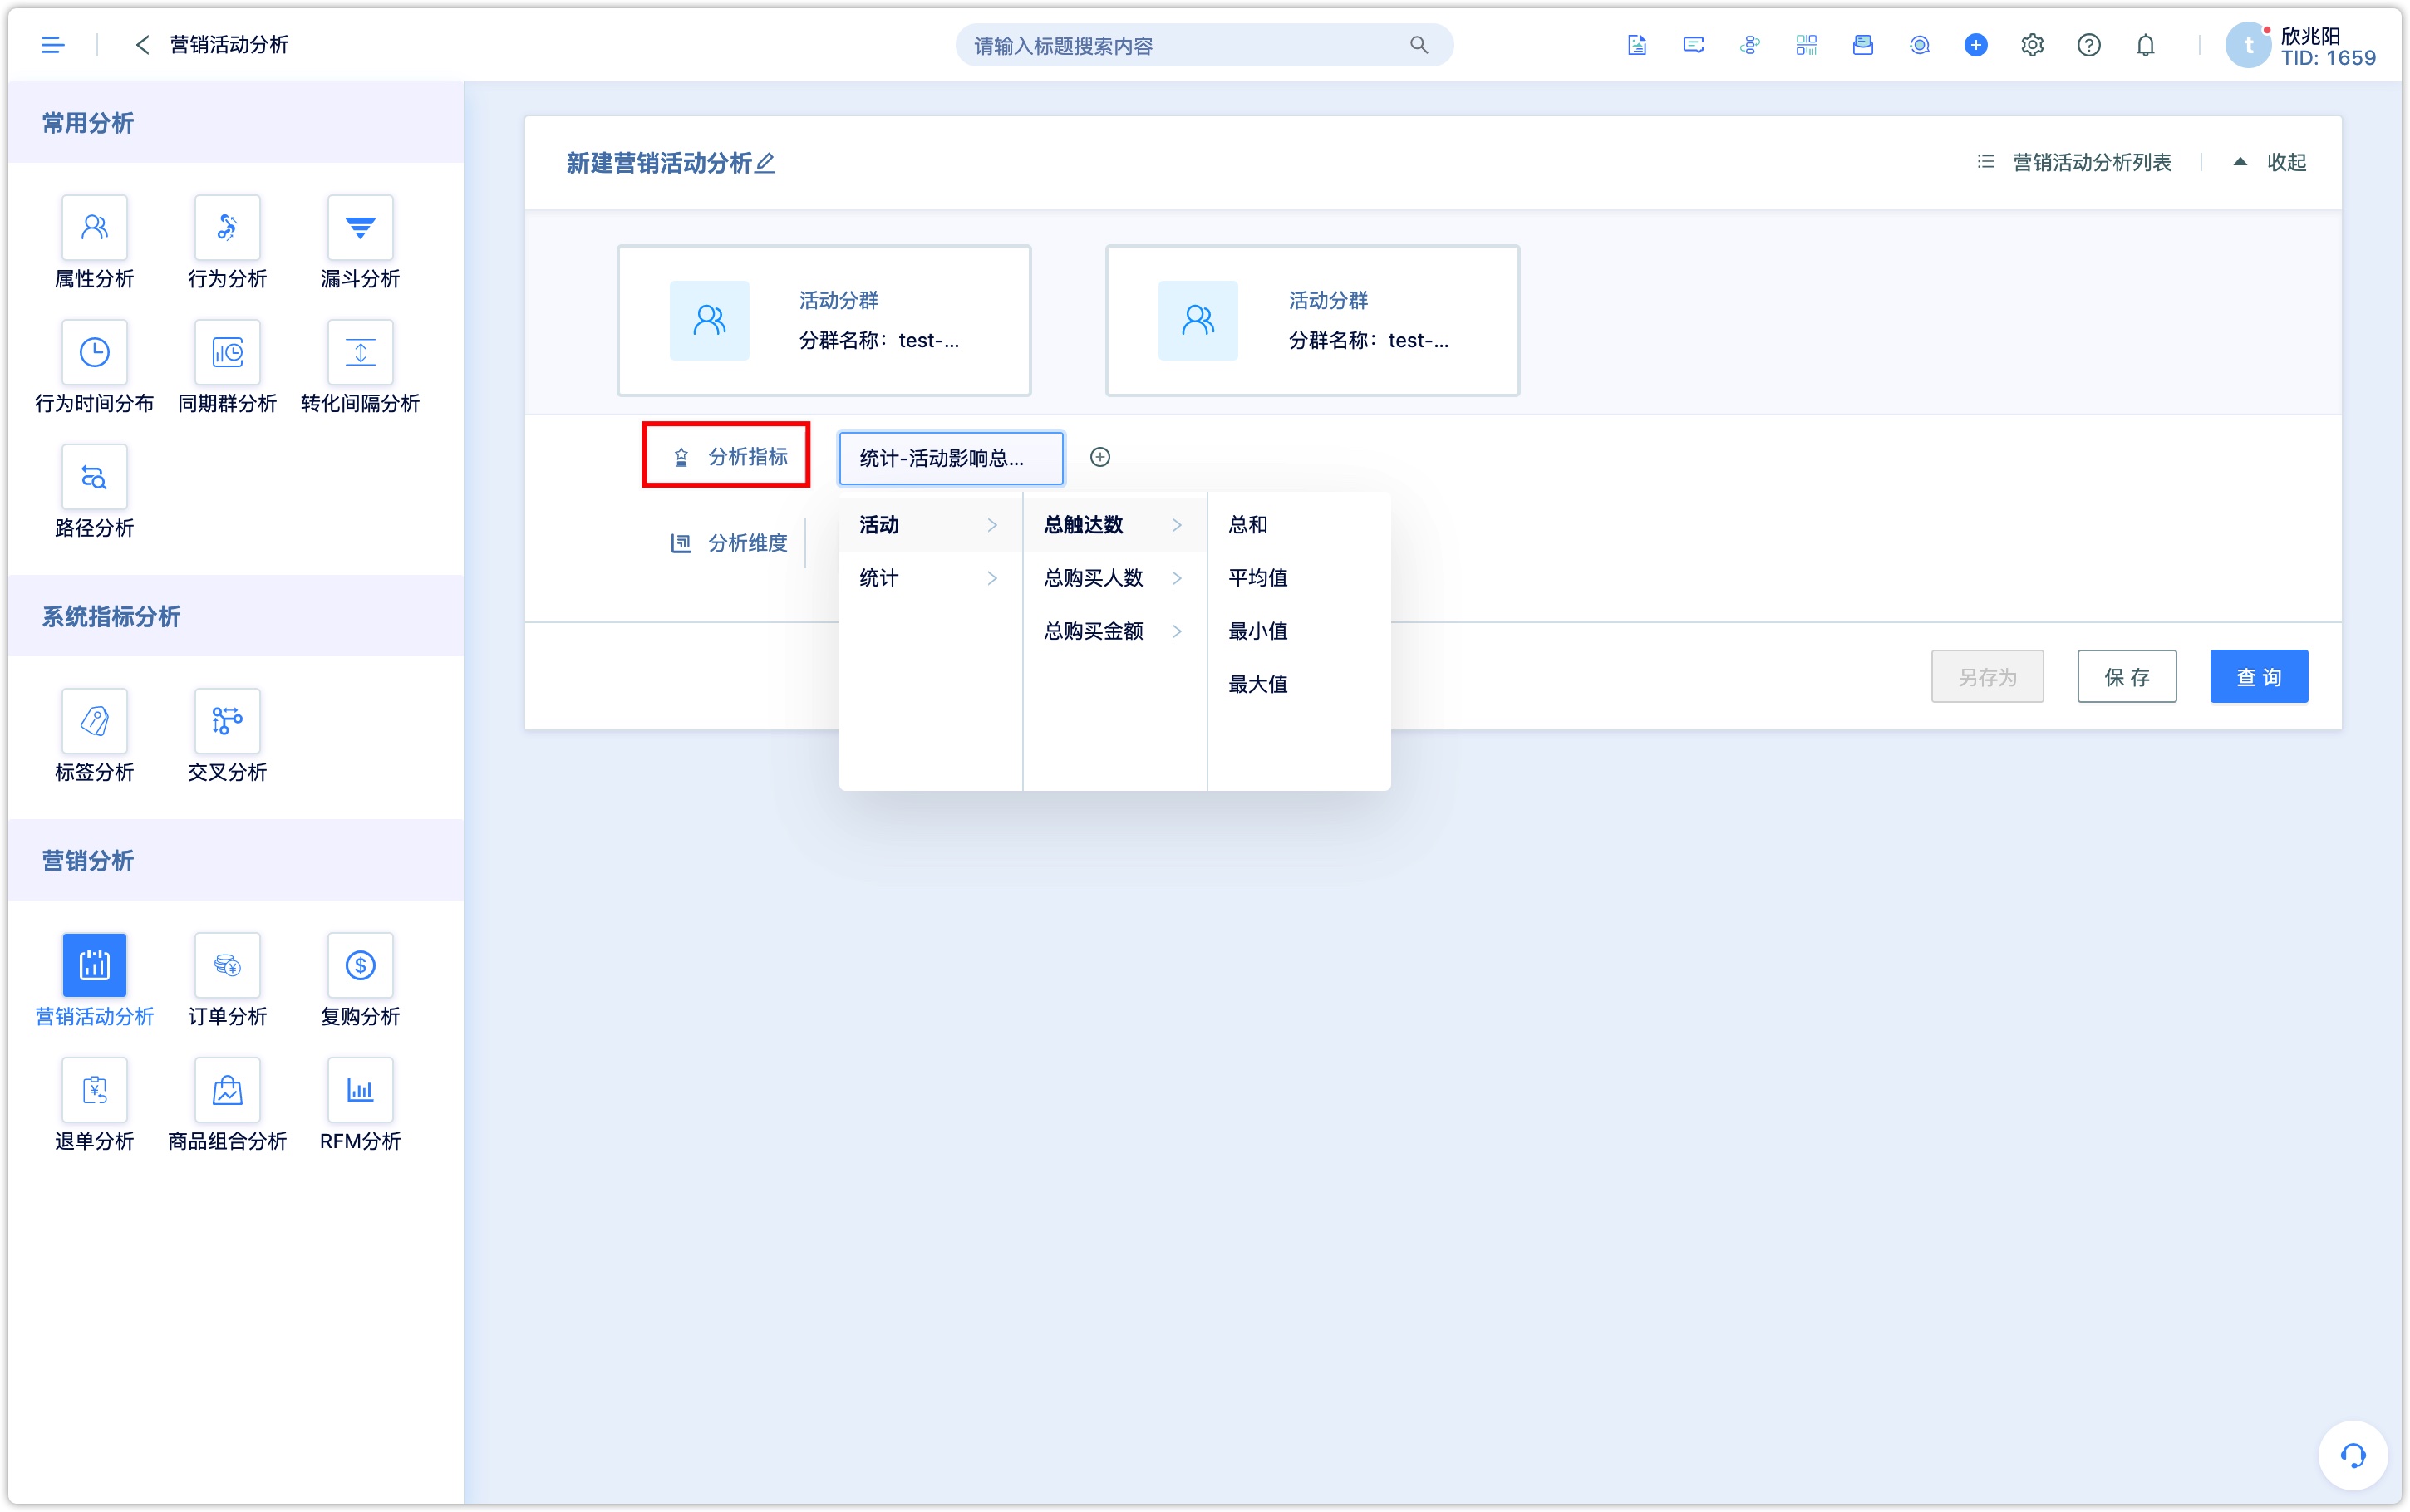
2.2Setting analysis indexes
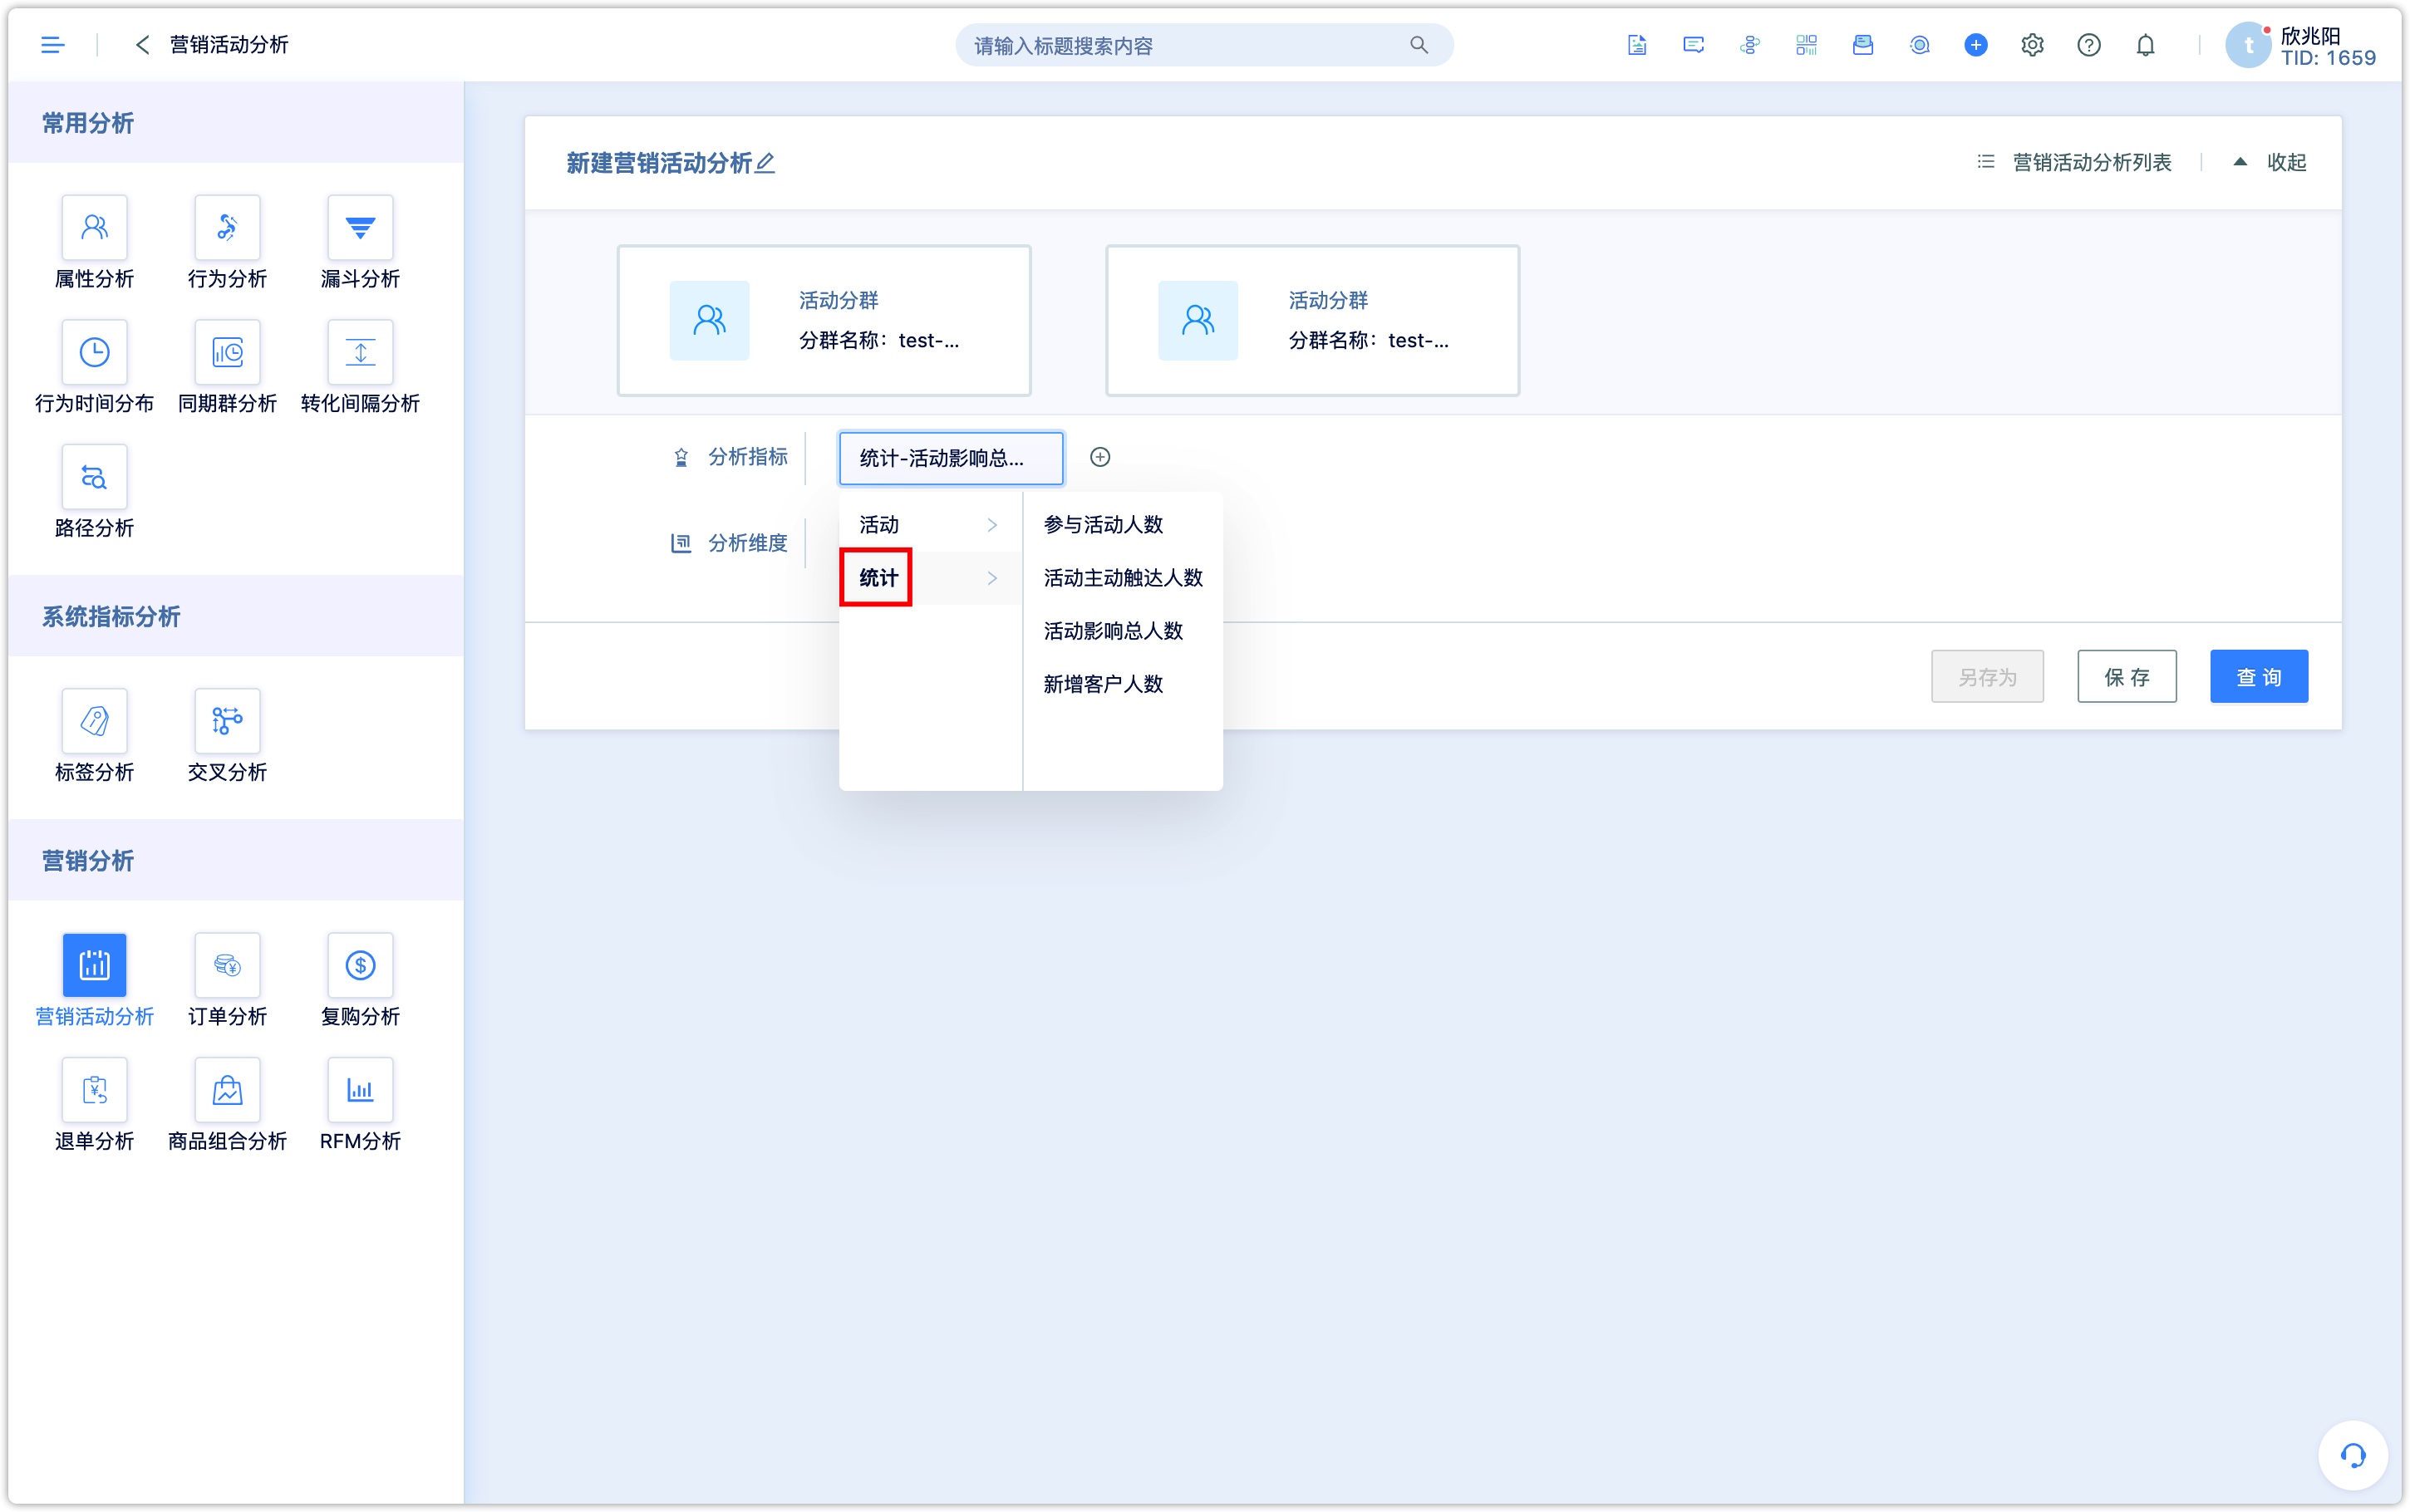
There are two types of analysis indexes for campaigns, activity index and statistics. Activity index is specifically targeted at numeric type campaign (numeric type of attributes need to be customized). The sum, average, and maximum value, minimum value is provided to review. Statistics indexes are the total number of participants, the number of proactively reaching participants, the total number of people covered by the campaign, and new customers.
 )
)
- the total number of participants与the total number of participants who interacted with any content associated with the campaign and generated inbound events in DM Hub.
- the number of proactive reaching participants:all the customers who have outbound events associated with the campaign. (such as, sending messages, emails, etc.)
- the total number of people covered by the campaign:all the customers who have activities associated with the campaign.
- New customers:All the customers whose attribute of “campaign” is the selected campaign. (this attribute will only be updated when a new customer is first created in the system.)
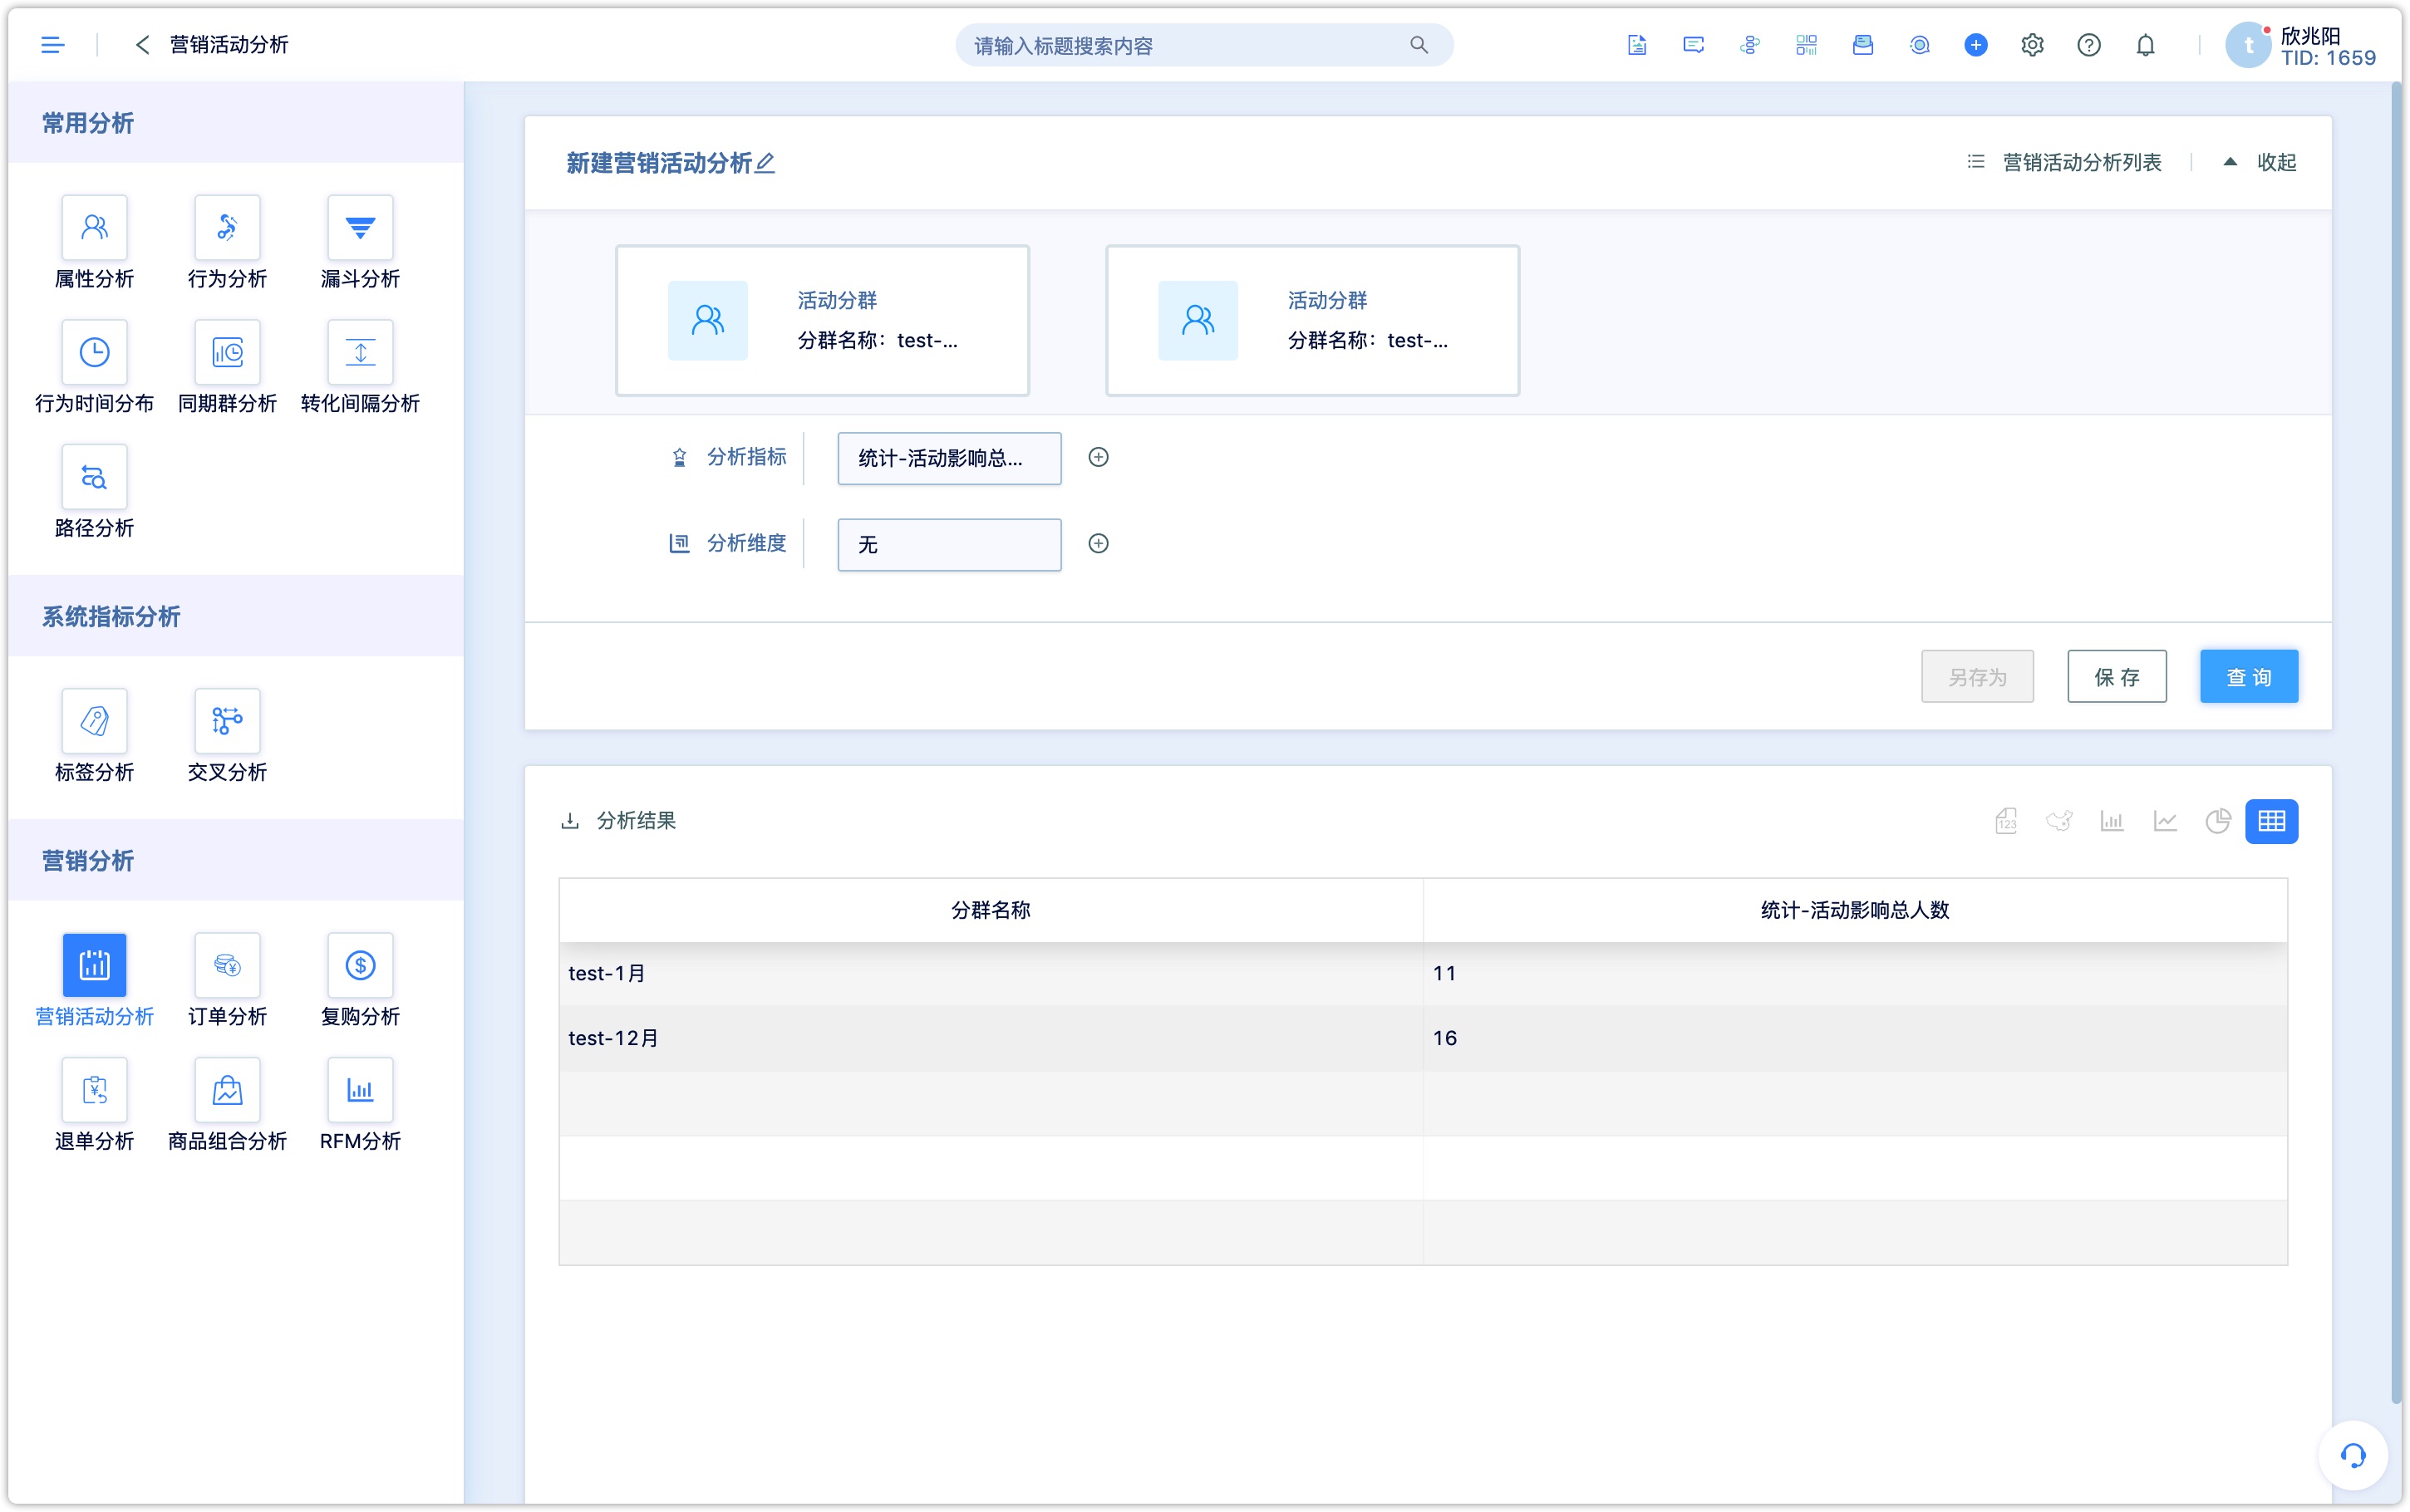
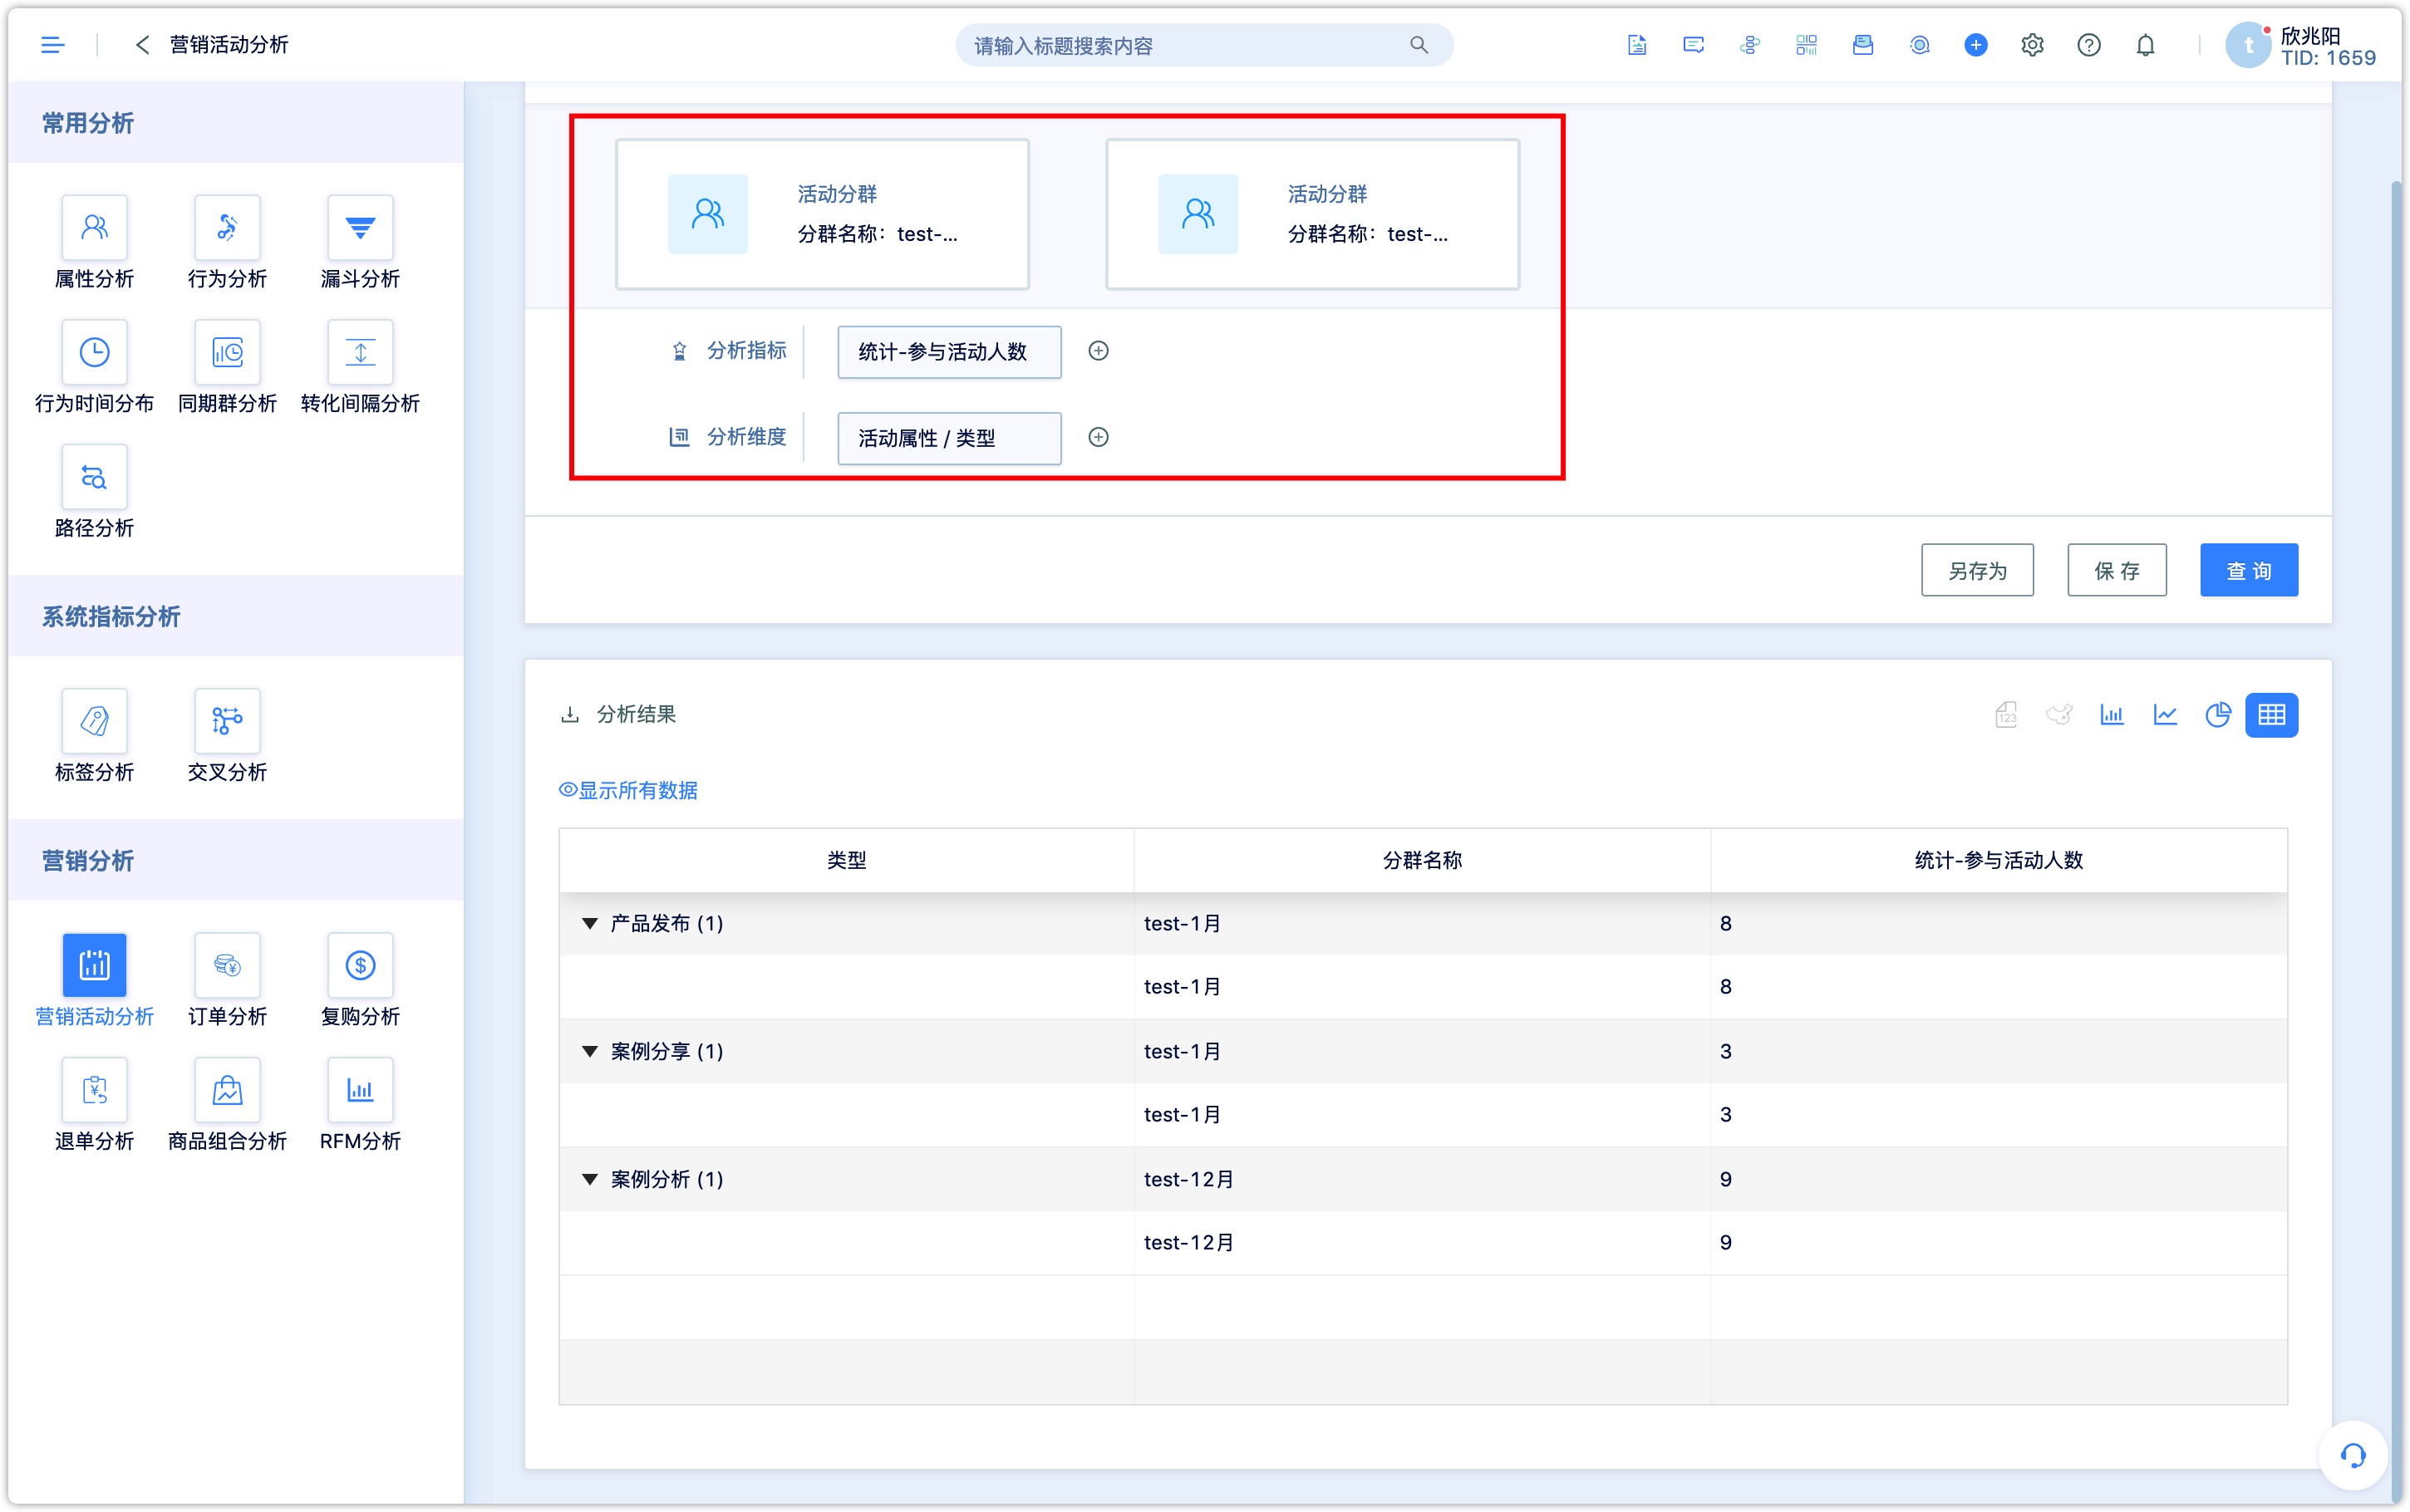
Combined with the comparison group added in the first step, as shown in the figure below, the analysis outcome is the comparison of the number of covered customers in January and December in the campaign created by test.
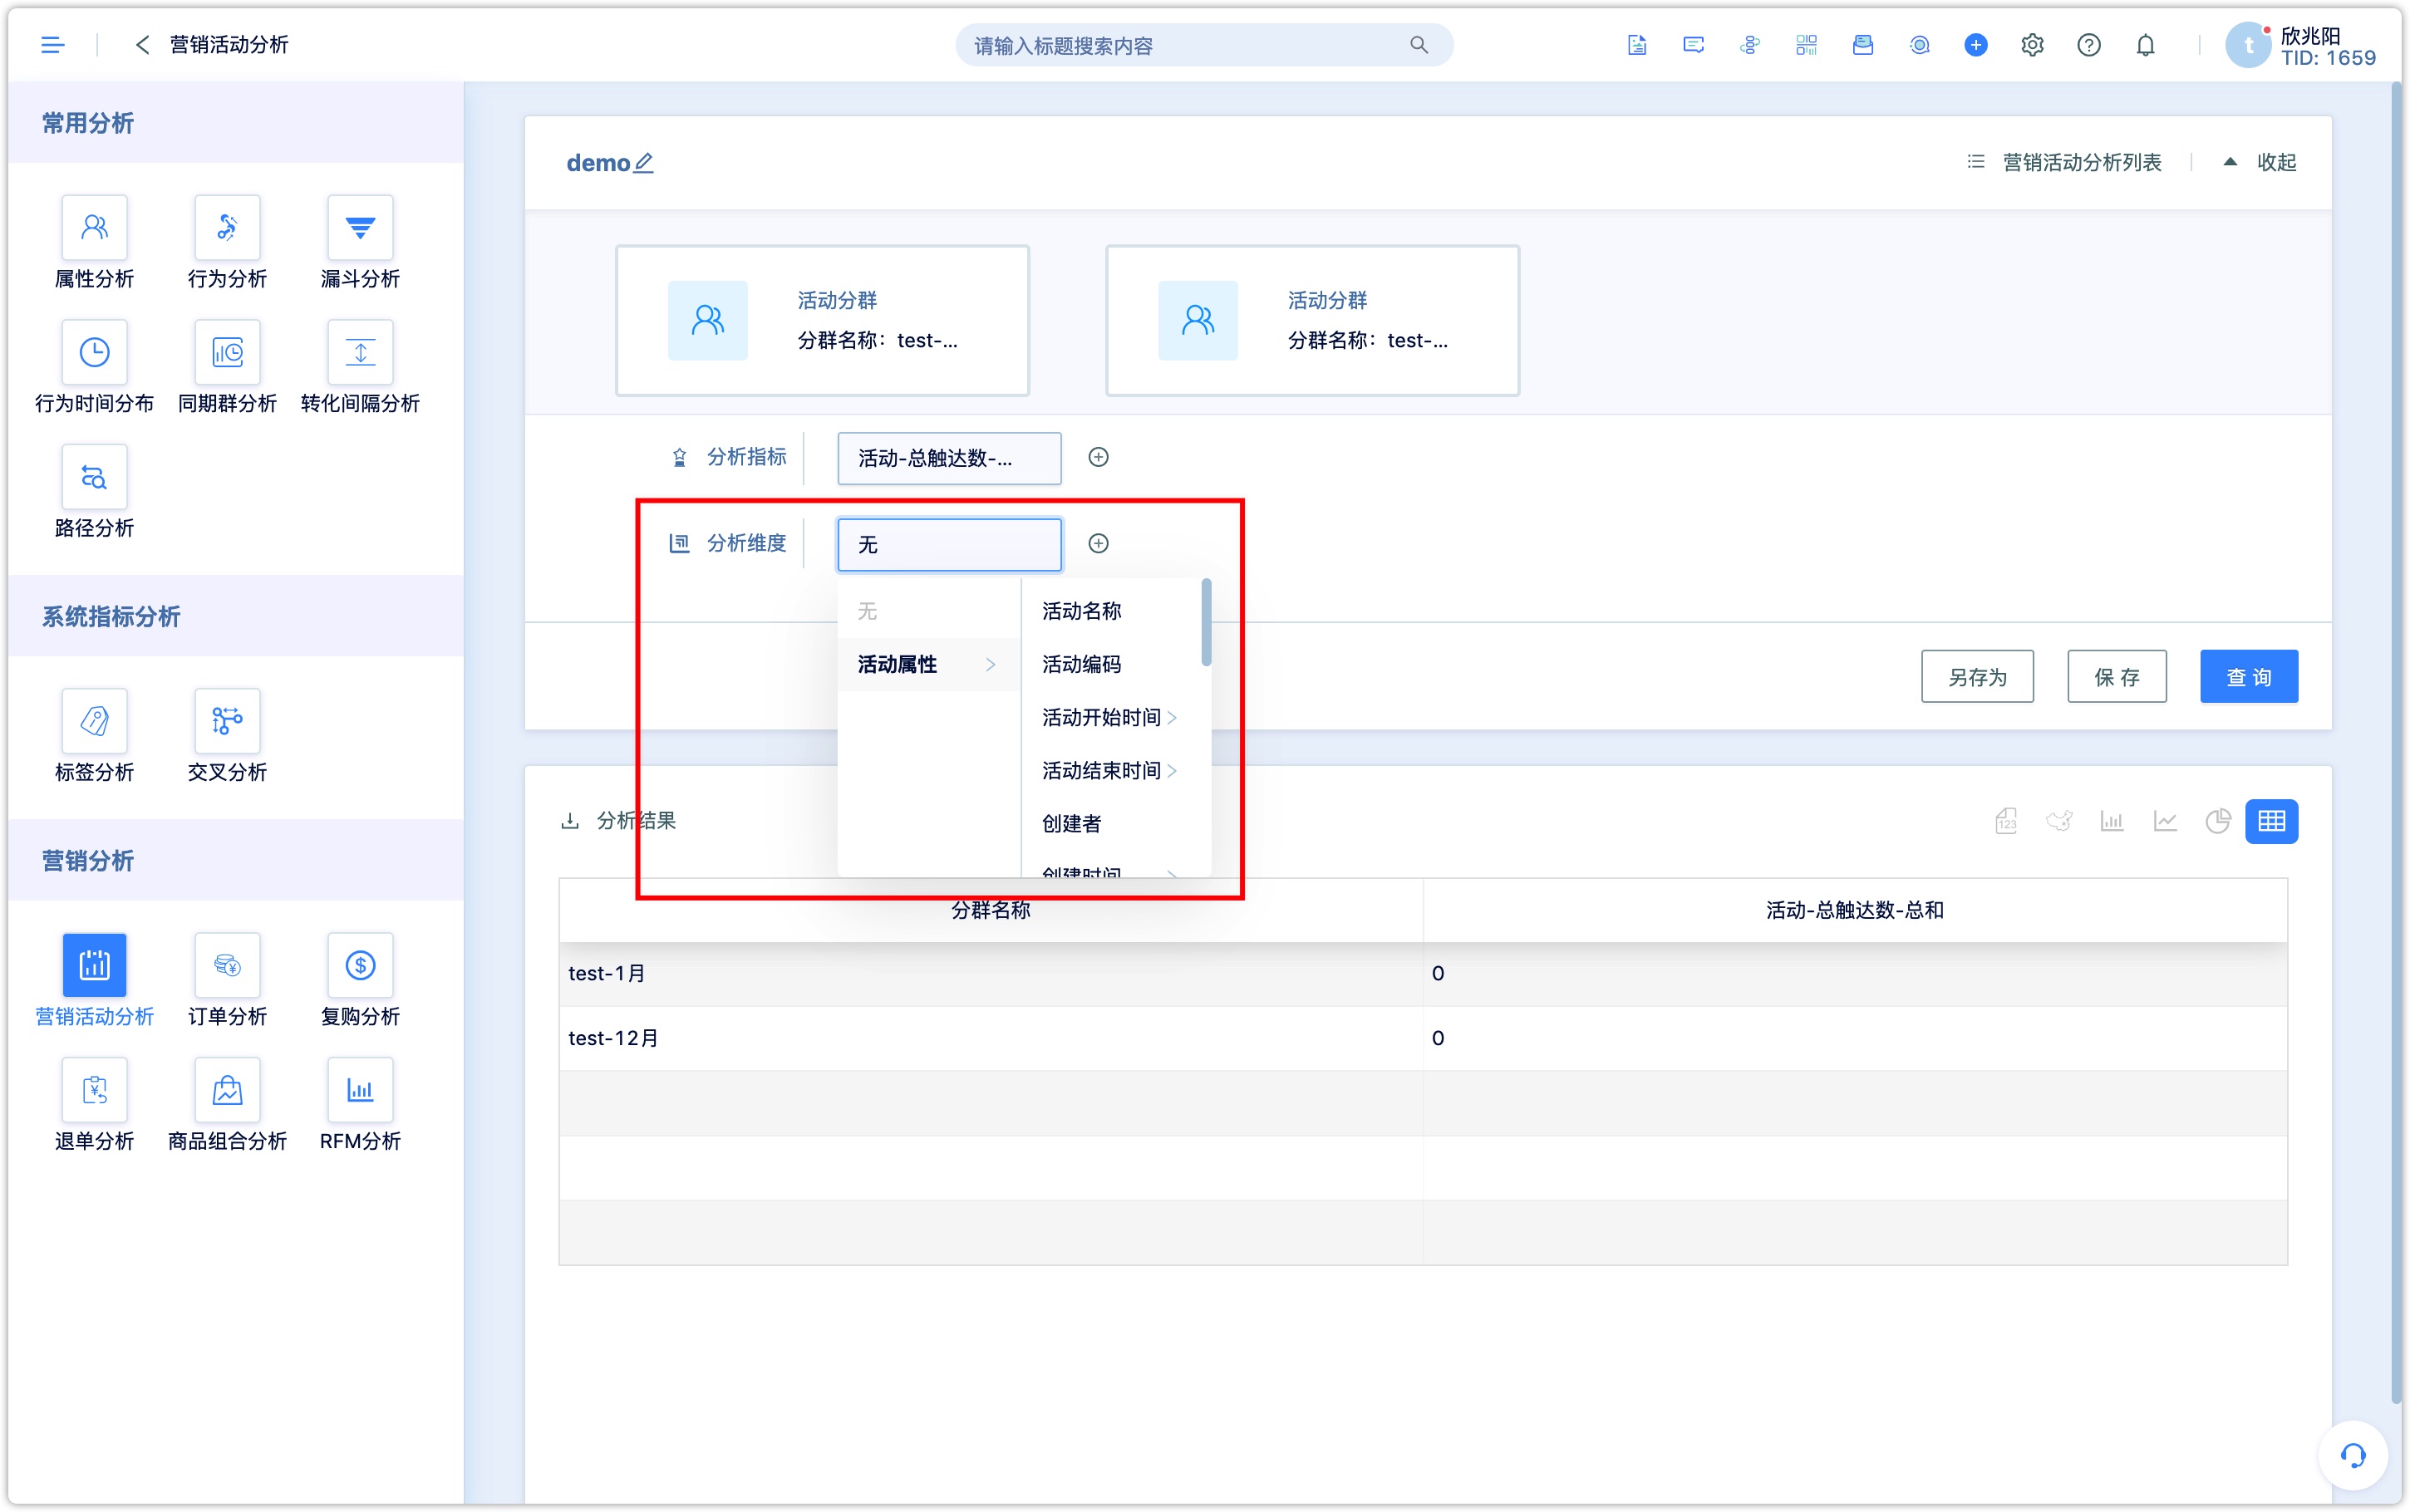
2.3Set analysis dimension
Set the attributes of the campaign as analysis dimensions.
Note: Both the analysis indexes and the analysis dimensions support up to 4 sets of conditions at the same time

2.4Scenario example
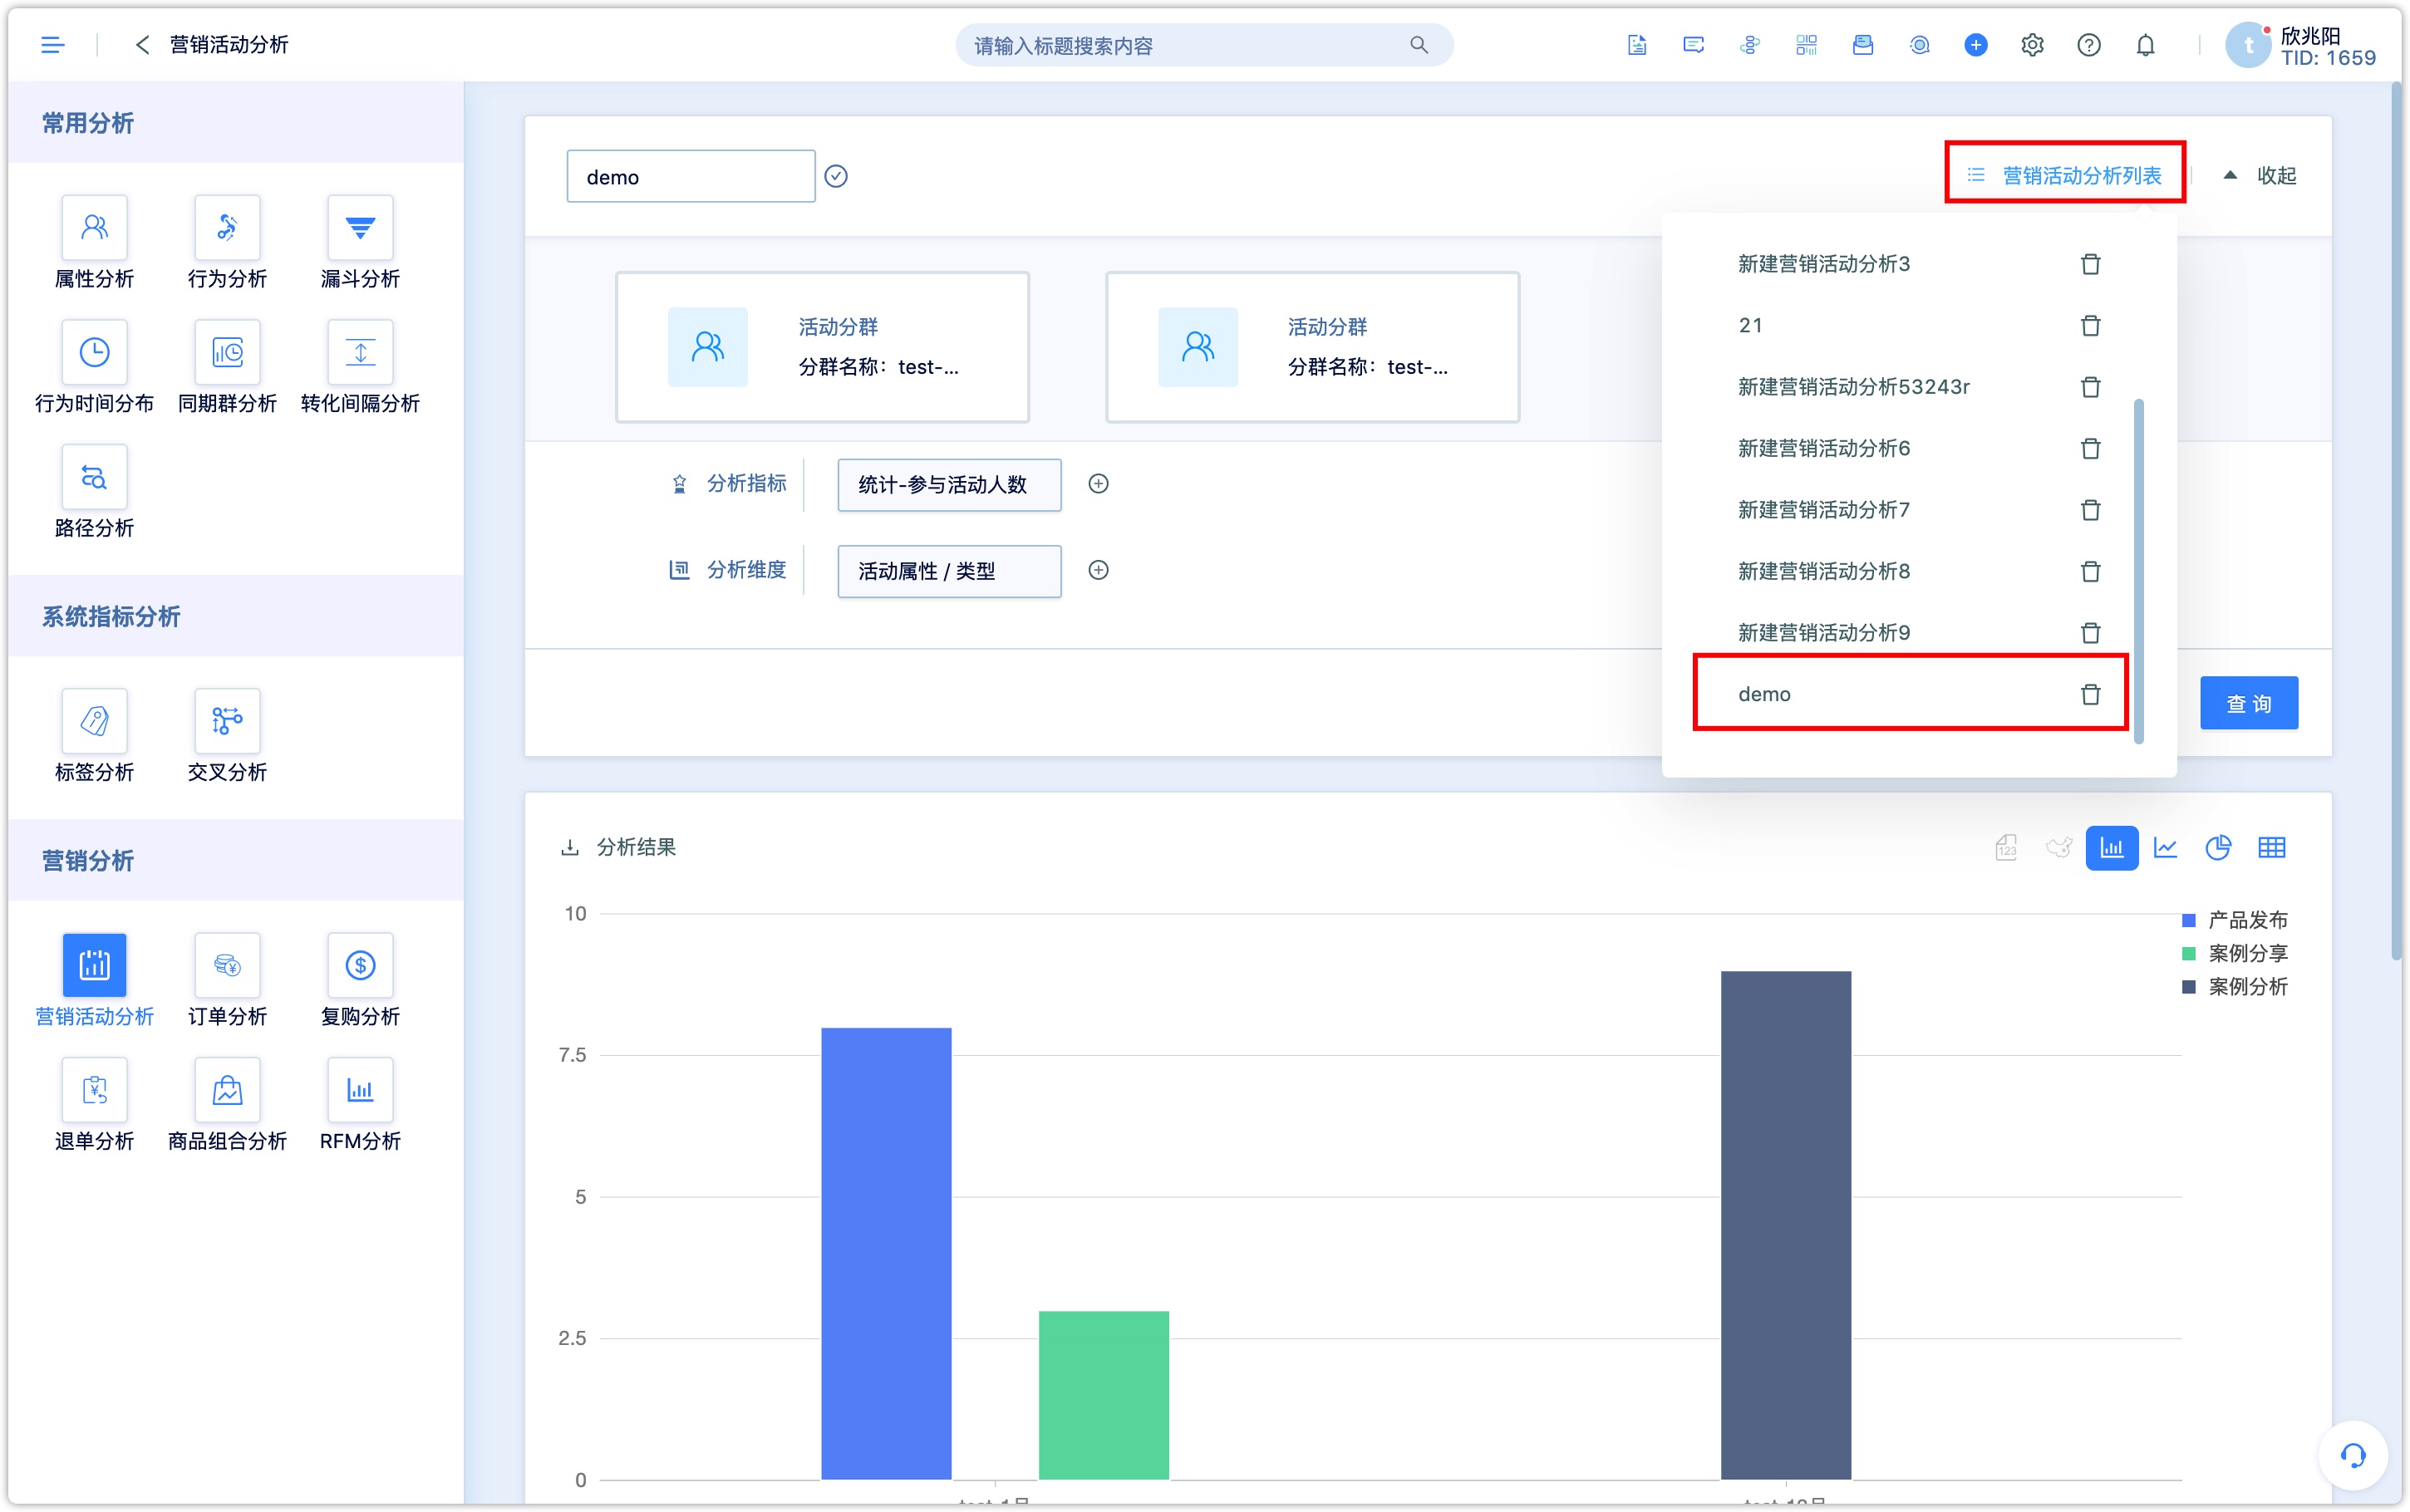
As shown in the figure below, "activity type" is customized in campaign attribute to distinguish different activities. This analysis is to compare the total number of campaign participants in January and December, created by test.
2.5Analysis chart setting and save
- Choose the appropriate chart type for display
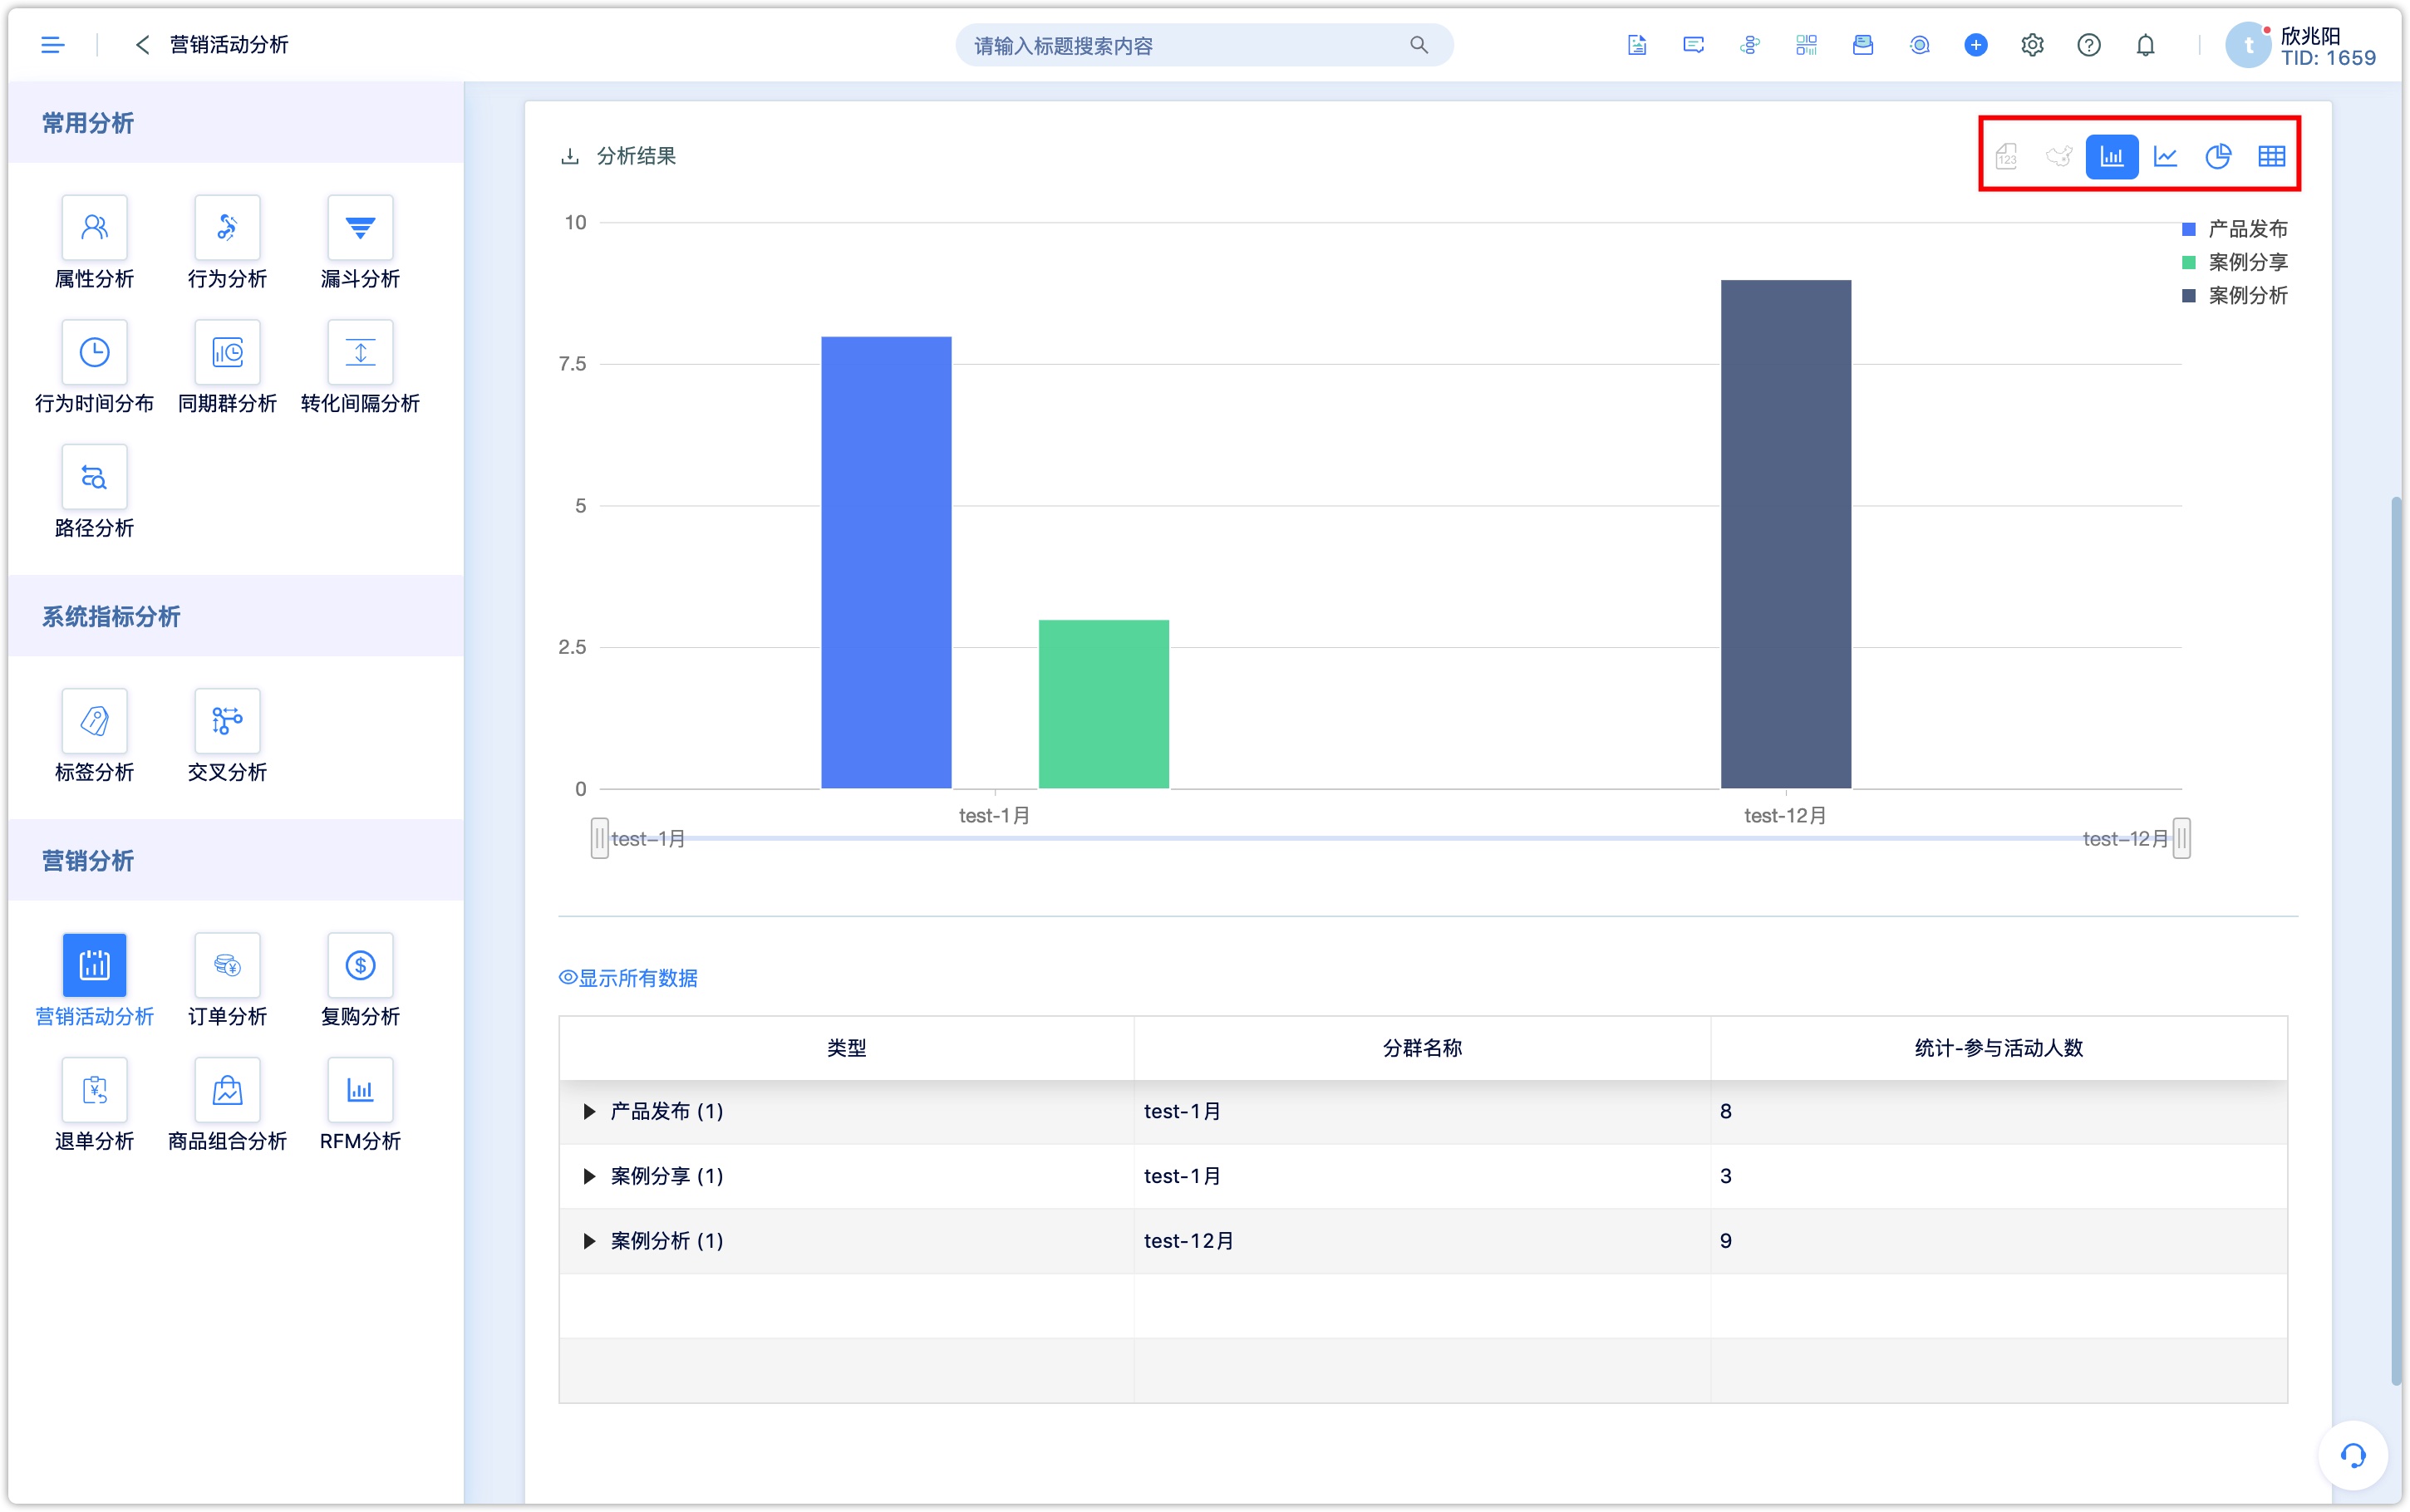
- The analysis chart can be saved and downloaded.
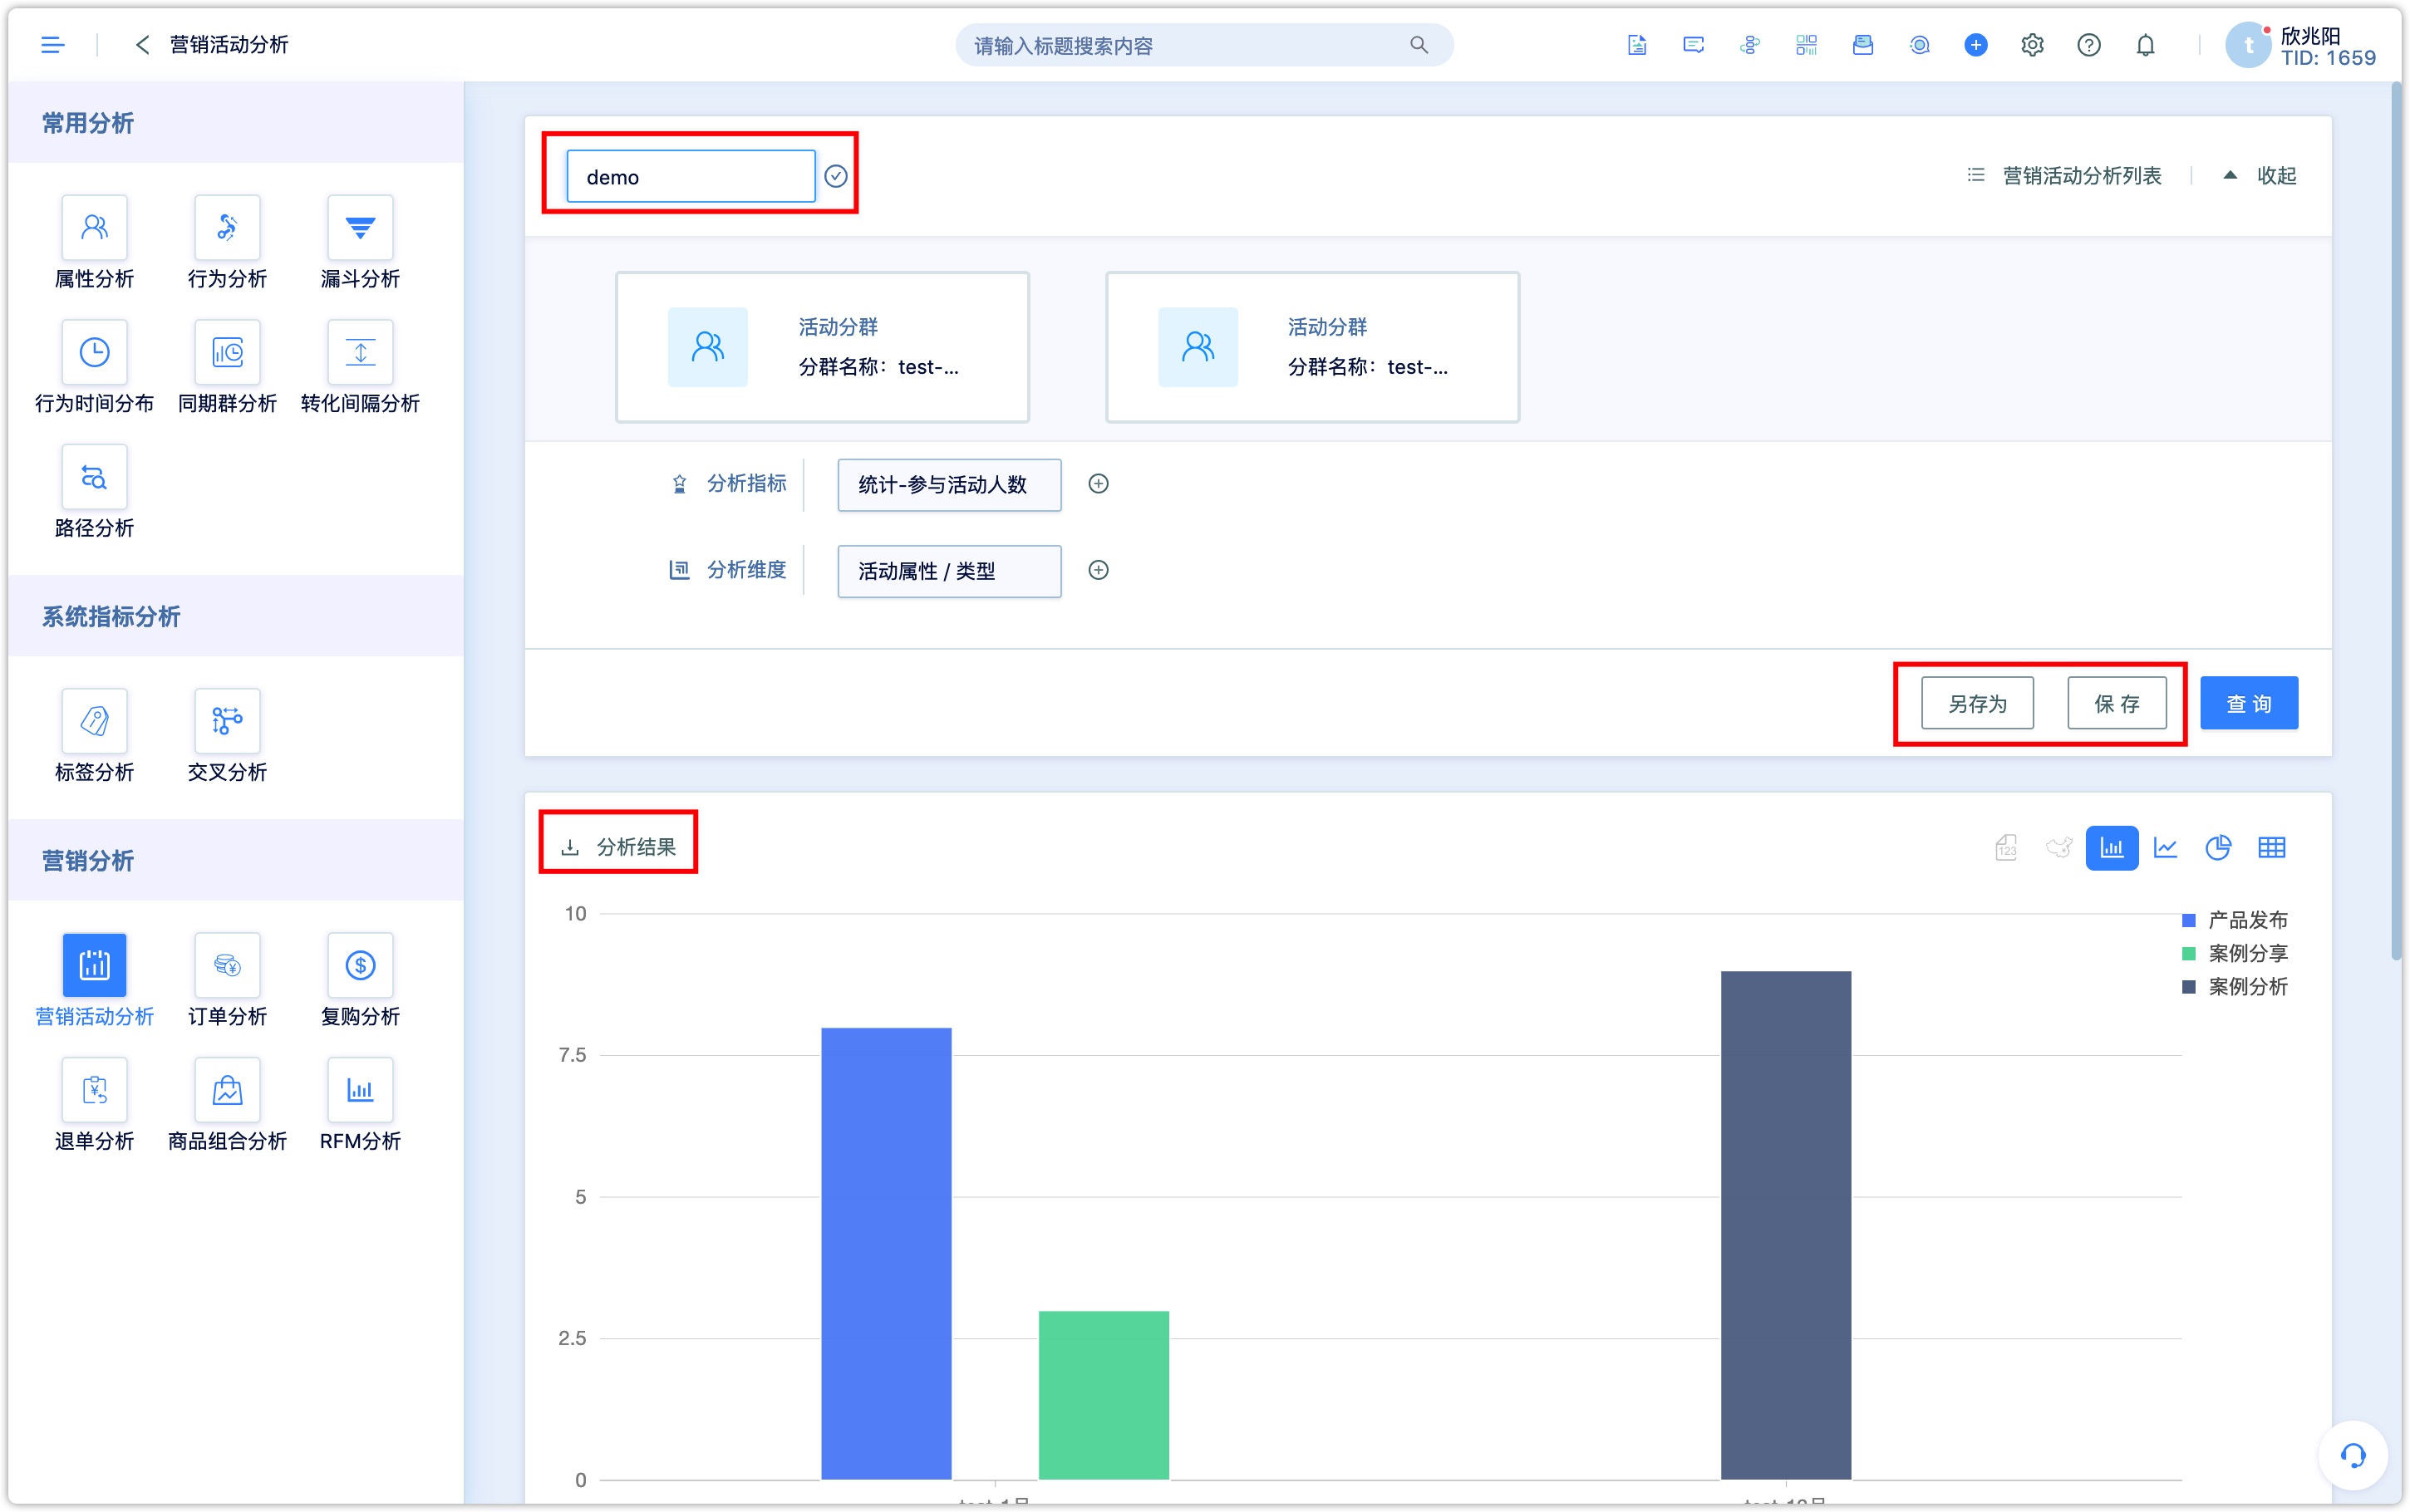
The “save” here is not directly to save analysis chart to data dashboard. it is the analysis list that the chart would be saved in.